
Dear investors,
Throughout our conversations and presentations to investors, we always highlight the importance of investing in quality companies with a long-term vision. In this letter, we will discuss in a little more detail the reasons behind this view.
We started the letter with a simple example: Let's assume it's 2010 and we have two investment options, both in companies of similar size and operating in the same segment. Companies have the following characteristics:
• Company A (“expensive” and profitable): P/E multiple [1] of 36x and historical return on equity (ROE [2]) of 25%
• Company B (“cheap” and average profitability): P/E multiple of 23x and historical ROE of 14%
Which company would you invest in?
Company A is costing 50% more than Company B when comparing the multiple based on the previous year's earnings. Is this “prize” worth it?
In the following years, both companies managed to maintain the ROE level at a similar level to history and grow net income. As a result of its higher profitability, company A was able to grow profit at a rate of 15% per year, while company B grew profit at a rate of 6% per year.
The net income and ROE of the two companies are illustrated in the chart below:
Graph 1 - Net income and ROE of companies A and B
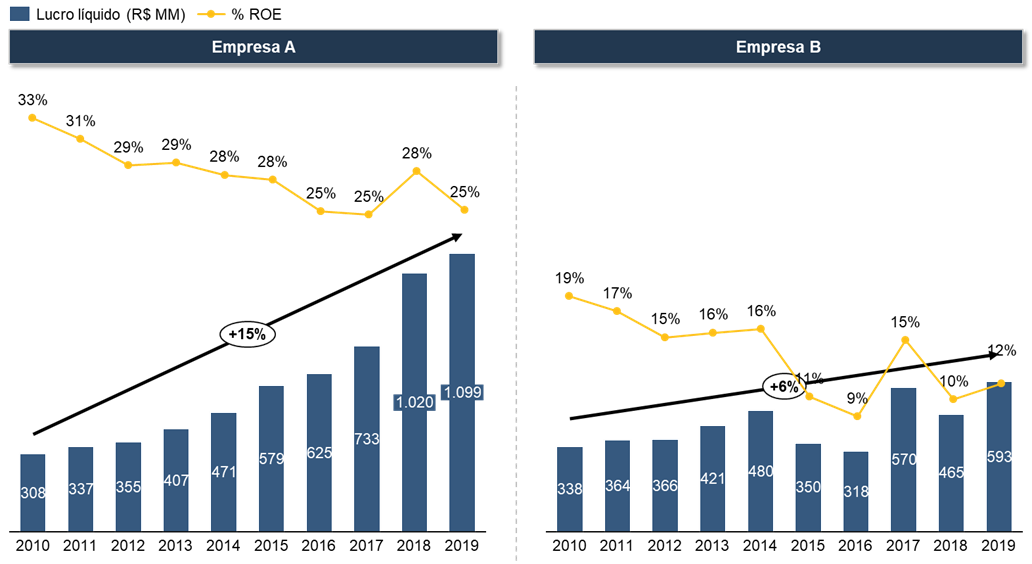
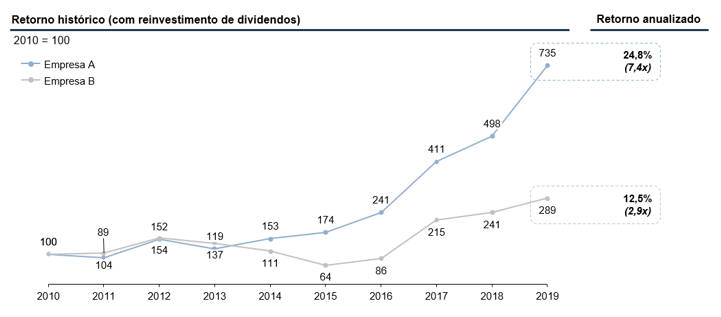
Even starting from a similar level, at the end of the period, the profit of company A was already almost double the profit of company B. Especially during the crisis period of 2015-17 was when the performance of company A stood out. As expected, company A's stock outperformed company B's stock, as can be seen in the chart below:
Graph 2 - Historical return of companies A and B
This example comes from a real case of two companies in the same sector. What are they?
• Company A: Renner
• Company B: Guararapes (Riachuelo brand) [3]
Good and well managed companies. Both performed better than the Ibovespa in the analysis period. But, in the period, Renner's performance was much better than Guararapes'.
This performance occurred because Renner was able to reinvest capital at a very high rate of return for a long period, which is a characteristic that only the best deals offer. To clarify the relationship between growth and profitability: in the example above, the two companies had a net profit close to R$ 300 MM in 2010. If the two used 100% of that profit to reinvest in the operation, the R$ 300 MM of Guararapes' profit would be monetized at a rate of 14% per annum (ie the ROE of the company) and would increase to R$ 342 MM in one year. In the case of Renner, the R$ 300 MM of profit would be profitable at 25% pa and would increase to R$ 375 MM (profit 10% higher than that of Guararapes). Due to the compound nature of the returns, the difference in profits tends to increase over time and, at this rate, Renner's profit would be 130% higher than Guararapes' in 10 years, more than justifying the 50% higher price paid at the beginning. This growth trend happens if companies reinvest 100% of profit in the operation with the same historical rates of return. However, in the real case, not all of the profit was reinvested (a relevant part was paid as dividends) and the growth obtained was a little lower than the theoretical example suggests.
Growing in this way, reinvesting the capital that the success of the business generates, is the healthiest and safest way for a company to grow and generate value for its shareholders. Not that it is the only way, as there are cases of companies that used external capital to invest in growth, spent years without profitability to restore it only after assuming a leadership position in their market. The problem with these cases is that while some went very well (like Amazon), others went very wrong (like Netshoes), and while these companies are sacrificing their results to grow, it is difficult to judge, looking from afar, which will be the winners. .
We also focus on profitability because, over the long term, the rate of return on an investment in a company tends towards the ROE of its business. The analysis below illustrates two theoretical scenarios:
• Company C: operates with a ROE of 20% per year, reinvests 100% of its profit at this rate, and trades with a premium of 30% in relation to the industry's average P/E multiple
• Company D: operates with ROE of 5% pa, reinvests 100% of its profit at this rate, and trades at a discount of 30% to the industry average P/E multiple
Assuming that an investment was made in these companies and soon after the share price converged to the sector multiple, what would be the return on this investment over time?
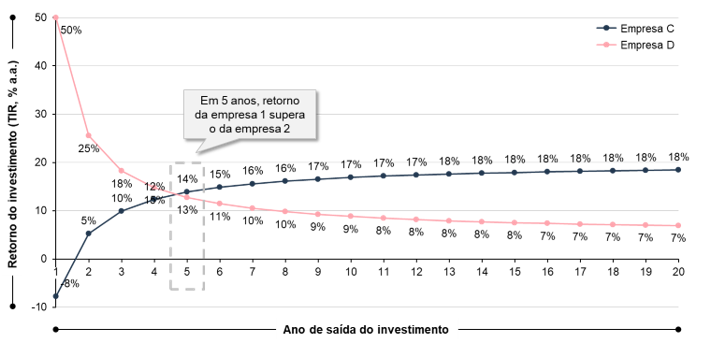
The chart below answers that question. For company D, in the short term the return would be excellent, but it would fall over the years. For company C, the opposite situation would be observed, the initial return would be low, but it would increase over time, surpassing the return of company 2 in year 5, and moving towards converging to its natural return level of 20% in the long term.
The graph brings two important lessons: (i) even paying “expensively” for company C, over time, the company is able to generate enough value to compensate for the “mistake” in the price of the initial investment; (ii) the long term is a friend of the great company and the enemy of the mediocre one.
“Time is the friend of the wonderful company, the enemy of the mediocre.” – Warren Buffett
Graph 3 – Theoretical return of stock C (high ROE, “expensive”) vs stock D (low ROE, “cheap”)
An important caveat: it is not enough to evaluate the company's history and assume that the observed historical ROE will be maintained in the future. When a company begins to earn a lot of money in a segment or product, the competition quickly, upon realizing the opportunity, seeks to enter this market. As competition increases, prices and margins tend to fall, leading to a convergence towards the sector's average cost of capital. Companies that do not have a privileged and sustainable competitive position will have their level of return reduced and the performance of their shares will follow.
Cielo is a recent case that illustrates this point. Until 2016, the company grew at a strong pace, always maintaining excellent ROE levels, and was one of the “darlings” of the stock market. For a long time, the means of payment sector was dominated by Cielo and Rede, which together had around 90% of the market. The companies had a monopoly on the operation of the main flags: Visa, Amex and Elo were exclusive to Cielo, while Mastercard and Hiper were exclusive to Rede. Many merchants were obliged to keep the machines of both companies in their premises, which allowed them to charge high fees. However, with the deregulation of the sector (started in 2010 and accentuated in 2016), this monopoly was eliminated, which allowed the entry of new players in the sector and harmed the competitive position of the incumbents.
The result was a sharp drop in Cielo's profit and ROE, which was accompanied by its stock market performance. The graph below shows Cielo's historical results:
Graph 4 – Net income and return on Cielo's historical share

To sustain the generation of value for shareholders in the long term, companies must be able to maintain their competitive advantages, which will translate into differentiated returns.
Predicting who will achieve this goal is a very difficult task. For this reason, we went deep to understand what are the competitive advantages of companies, what are the risks of disruption to which they are subject, and whether the management team is good enough to keep the company ahead of the competition.
Identifying good companies is only part of the job. The other is to have the patience and discipline to invest in them at the right price. Good companies are available on the market every day to be bought, usually at a price far above what we would like to pay.
[1] P/L (Price / Earnings) is a multiple widely used in the financial market. It measures a company's market value relative to its annual net income. As a rule, the higher the multiple, the more “expensive” the company tends to be. [2] ROE (Return on Equity) is calculated by dividing net income by a company's equity. ROE is a measure of a company's financial performance as it indicates how well the company uses its resources to generate profit for the shareholder. The higher the earnings for a given amount of equity, the higher the company's ROE. [3] In the analysis above, Guararapes' 2018 net income and ROE were adjusted to disregard non-recurring tax gains.