

Dear investors,
The moment of uncertainty we are living in caused by the Covid-19 crisis has generated large fluctuations in the markets, which can cause anxiety for investors, especially those who have recently started investing in the stock market. Having a historical perspective on these moments helps us draw parallels with the present, and allows us to try to imagine what might happen in the future.
With that in mind, last month we wrote a letter in which we addressed the issue of investments in times of crisis. This month, we decided to go deeper into the topic and bring a broader perspective, comparing investments in stocks with investments in fixed income over long periods of time.
We divided the content into two parts. This first letter brings an international perspective that compares the historical return of equities vs. fixed income in several countries. In the second, which we will send next month, we will talk about the Brazilian context.
In both cases, what is evident is that, in the long term, investing in variable income (shares) yields better returns on capital than fixed income. An important caveat is worth noting: Despite the superiority of variable income, we are not recommending that investors invest in variable income with “eyes closed”. It is necessary to be careful and try to choose the right companies and the moment of investment (paying dearly for a share, even in a good company, can be a bad investment for many years).
1. The North American example:
In a very long-term analysis (more than 200 years) of the North American market, a persistent gain of equities over other asset classes was demonstrated. The chart below presents the historical return adjusted for inflation over the period 1800-2012:
Graph 1 – Historical real return of several asset classes[1]
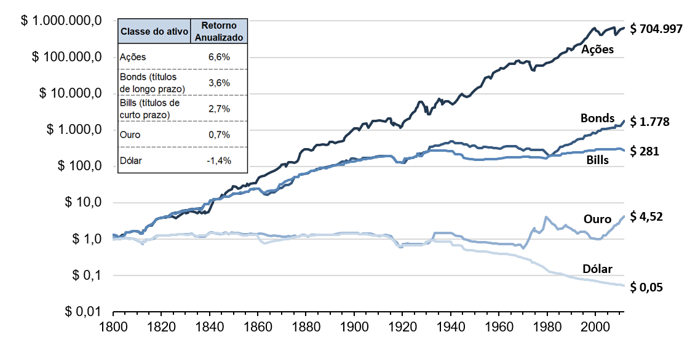
From the chart above, it's clear that stock valuations not only dominate all other classes, but are also remarkably stable over the long term. Over the period, equity investment led to a real return of 6.6% per year quite consistently – this means that, at this rate, invested capital has doubled every 10-11 years.
Evaluating from a long-term perspective, the ups and downs of the market generated by alternating periods of optimism and pessimism are not very representative in the general trend of wealth accumulation provided by investment in stocks.
2. International benchmarks:
Many may criticize the above analysis as it focuses on the United States, a country that over the past 250 years has transformed itself from a British colony into the world's leading economic power. But an analysis of 20 major global economies shows that equities have substantially outperformed fixed income in all countries analysed.
Graph 2 – Real Return on Fixed Income vs Variable Income (in USD, per year)[2]
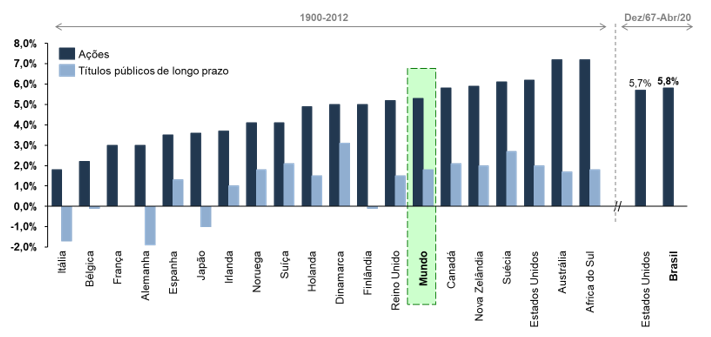
Between 1900 and 2012, real returns ranged from 1.7% pa in Italy to 7.2% pa in Australia and South Africa. The United States, whose data were the basis for the conclusions of the previous section, had a return of 6.2% in the period – great returns, but not much higher than the global average of 5.4%.
This result was achieved despite numerous economic, political and social changes. Many countries have moved from an agrarian to an industrial economy, and from an industrial to a service and technology oriented economy. In this period, there was also no shortage of crises – since 1900, the world has gone through 2 world wars, a pandemic (Spanish Flu), the Great Depression of 1929, the cold war, the oil crisis of the 70s, the attack on the twin towers, the economic crisis of 2008 and, more recently, the Covid-19 crisis. Despite this, historical stock returns show impressive resiliency.
Although the series used for Brazil is shorter, “only” 52 years vs. 112 years for other economies, we have no reason to believe that this fact would be different in Brazil. An investor who “bought” the Brazilian Stock Exchange in 1967 and reinvested the dividends received would have, in April 2020, a real annual return of around 5.8% per year in dollars, slightly higher than the real return of 5.7% per year obtained by investing in the American stock exchange in the period.
About the results for Brazil, we analyze in more detail in part 2 of this letter.
3. Risk discussion:
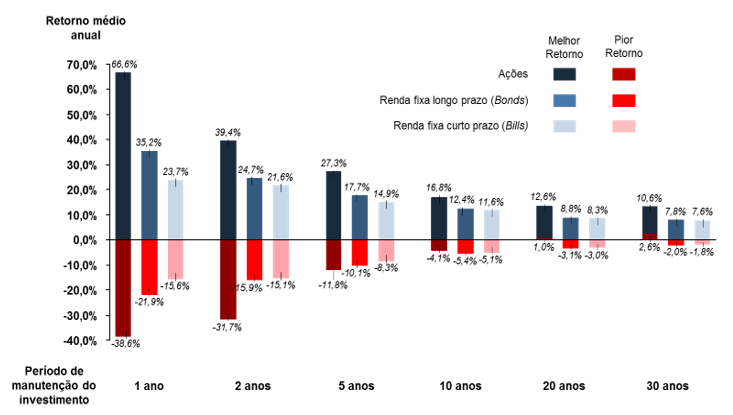
The analysis wouldn't be complete if we didn't also consider the worst scenario: let's assume that an investor entered the stock market just before a major devaluation. Wouldn't it be better for him to have invested in fixed income? The truth is that, if the investment period is a few years, stocks can indeed present a poor return – in the worst case scenario, a 1-year investment in the American stock exchange had a return of -38.6% against a return of -15.6% of short-term fixed income (bills). However, for a longer term period, the risks are limited. The worst annualized return for a 10-year investment window on the US Stock Exchange was -4.1%, higher than the lowest return obtained in fixed income over the same 10-year period, which was -5.1%. Over a 30-year period, the worst return on an investment in the stock market was +2.6% per year!Graph 3 – Highest and lowest return on investments in equities, short-term and long-term fixed income for holding periods of 1, 2, 5, 10, 20 and 30 years between 1802 and 2012 in the US [3]
The risk profile of the stock market is in line with the data in the table below, which shows some very interesting data:
Table 1 – Variable income vs fixed income return for different investment maintenance periods (Analysis between 1802 and 2012 for the US market) [4]
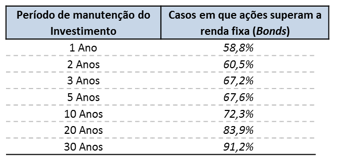
Considering investments with a 1-year term, equities outperformed fixed income by around 60% of the time. In other words, every 5 years of investment, in 2 years we observe a fixed income higher than the stock market! On the other hand, for an investment held in the portfolio for 30 years, the Stock Exchange outperforms fixed income by 91% of time (considering the last 210 years). This point is important, because many investors “relocate” their portfolio frequently after the best returns, but end up, in fact, missing the best opportunities!
An analysis performed for the US market illustrates the impact a hypothetical investor would suffer from being out of the market for just a few of the best market return days in the past 36 years!
Graph 4 – Hypothetical growth of a USD 1.00 investment in the S&P 500 from Jan/01/1980 to May/20/2016[5]
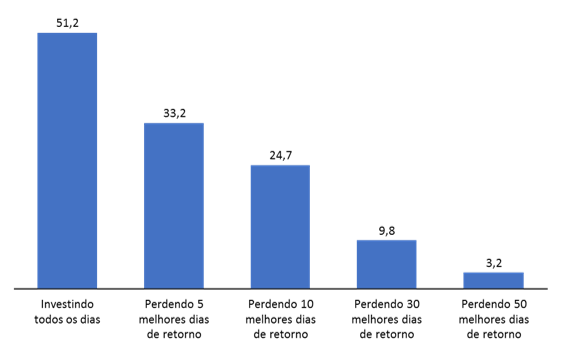
The truth is, in addition to the transaction costs (brokerage, income tax on capital gains) involved with portfolio switching, getting market timing right is extremely difficult for even the best managers. High interest rates tend to occur in crisis situations, precisely when the stock exchange is cheap and can offer real bargains. Thus, instead of trying to find the best portfolio, it is preferable to limit yourself to the good and what you already know, and not run the risk of making a mistake.
All the analyzes above consider an investment in the stock market to be an investment in the stock index of that market. We believe that a manager who shares the long-term philosophy, and who selects the best stocks (good companies at a good price) for his portfolio, can perform even better.
4. The rationale behind stock returns:
After reviewing the historical evidence and the undeniable superiority of equities over other asset classes over the last 200 years, the questions that remain are: Why is this happening? And what can we expect for the future?
Firstly, shares are fractions of the capital of companies, which allow investors to enjoy the profits generated by such companies. Part of these profits can be paid directly in the form of dividends or share buybacks, and part of them can be reinvested, either to expand operations or to make acquisitions. Regardless of the use, in the long term, the return of a stock tends to follow the growth of profits and dividends received by the company.
When we look at the market as a whole, corporate profit growth is closely linked to economic growth, which has been extremely robust, especially since the mid-nineteenth century. The chart below shows global GDP per capita from 1500 to the present day.
Graph 5 – Global GDP per capital (In USD thousand, 2017 values) [6]
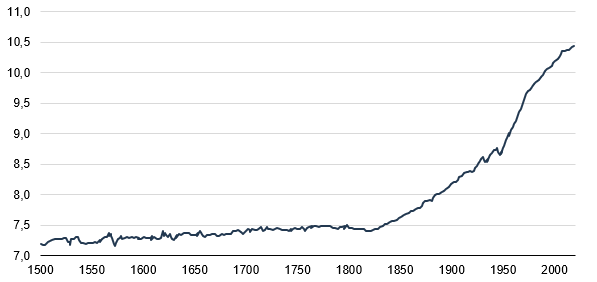
What is behind this growth is the constant increase in productivity that humanity has observed. People study, learn and develop new technologies. Each generation works and improves the technologies developed by the previous generation, and through this accumulated knowledge, the world has increasingly efficient ways of developing products and services. In addition to leading to economic growth, increased productivity also improves the living conditions of the population as a whole.
Looking ahead, the trend is for the pace of human productivity growth (and, consequently, economic growth) to continue. The current Covid-19 crisis brings many challenges, but it also highlights our incredible technological development – the home office that today many of us manage to do without major difficulties is only possible thanks to the technologies developed over the last few decades. The crisis also forces us to be more and more productive, with trends that already existed before the crisis being accelerated (online shopping, digital banking services, industrial automation, among others). Although the duration and economic impacts of Covid-19 are still quite uncertain, the evidence of this crisis only reinforces our conviction in the trend of economic development, and appreciation of stocks, that awaits us in the long term.
[1], [2], [3], [4] Source: Stocks for the Long Run, Jeremy J. Siegel (2014)
[5] Source: Fidelity – FMRCo Asset Allocation Research Team
[6] Source: The Changing World Order: Why Nations Succeed Or Fail, Ray Dalio, 2020