
Small cap investment
Dear investors,
Historically, investments in small caps have proven to be a profitable and consistent way to outperform market returns. Small caps These are companies with the lowest market value and, due to their size, are often ignored by investors. This neglect creates price asymmetries and, consequently, investment opportunities.
In this month's letter, we explore the topic and bring some research based on historical data that shows the advantages of investing in small caps.
Although there is no official definition that establishes whether a company is a small cap, in general, it is considered small cap a company whose market value ranges from US$1.5 billion to US$1.5 billion (R$1.6 billion to R$10 billion at the current exchange rate of R$5.20). In Brazil, the B3 has a stock index small caps (SMLL)1, which represents a portfolio of 110 companies and, currently (August 2021), the market value of the companies in this index varies between R$ 210 million (Recrusul) and R$ 23.8 billion (Banco Pan), with an average of R$ 5.0 billion – values in line with the international reference.
It is often associated with small caps the startups, companies in the early stages or that are not yet profitable. This association is quite mistaken. Many small caps These are companies with proven business models and a solid and profitable financial history, that is, quality companies that, at the right price, can be excellent investment opportunities.
And such opportunities do arise from time to time. Due to their small size, these companies often have low liquidity and are often overlooked by investors. Many funds and institutional investors even face legal restrictions that prevent them from investing in them. small caps.
Furthermore, small caps have additional advantages: (1) given their size, small caps are easier targets for M&A transactions and (2) companies often still have ample room for growth, which tends to favor the appreciation of their shares.
Today's big companies have already been small caps one day. Investors who limit themselves to investing in large companies sometimes end up investing after much of the stock's appreciation has already occurred. For example, Magazine Luiza was worth R$300 million in 2016, and today it's worth R$126 billion!
There may be growth opportunities within large companies, but these situations are rarer. These companies have often already grown sufficiently to achieve significant market shares in their markets, and growth alternatives become scarcer, or they involve expanding into new markets or geographies, distancing them from the competencies and competitive advantages that brought them success in the first place.
These positive factors are reflected in research findings on the topic. In 1981, Rolf Banz, a student at the University of Chicago, investigated stock returns according to their size. He found that small caps presented returns higher than large caps consistently, even when adjusted for risk.
To analyze this statement, the table below presents stock returns divided by market size from 1926 to 2012.
Table 1 – Decile Returns by Firm Size, 1926–2012, USA2
| Size decile (smallest to largest) | Annual return | Excess return relative to CAPM |
|---|---|---|
| 1 | 17,0% | 9,6% |
| 2 | 12,8% | 3,6% |
| 3 | 11,3% | 1,9% |
| 4 | 11,3% | 1,6% |
| 5 | 11,0% | 0,7% |
| 6 | 11,0% | 0,7% |
| 7 | 11,2% | 0,8% |
| 8 | 10,2% | -0,1% |
| 9 | 11,0% | 0,8% |
| 10 | 9,3% | -0,0% |
| Total market | 9,7% | 0,0% |
The annualized return of the smallest stocks in the table was 17.0% per year, a level substantially higher than the average market return of 9.7%.
A common criticism of investments in small caps is that they are riskier and should therefore be avoided or limited in the investor's portfolio. This is not what the table above shows. The second column shows the level of return in excess of what would be expected given the volatility level of each group of stocks, and it is clear that even adjusting for this factor, investments in small caps show a superior risk-return history.
Obviously, the risk should not be ignored. Unlike large caps, it is common to find greater difficulties in accessing important information for investment evaluation, but with careful and disciplined analysis, seeking to understand the company's business in depth, we believe that attentive investors are able to identify and manage the risks associated with investments in small caps.
This result is consistent not only in the US but also in several other countries. Tables 2 and 3 below show, respectively, the results of surveys conducted on stock returns in the UK between 1956 and 1987 and Japan between 1966 and 1983.
Table 2 – Decile returns according to firm size, 1956–1987, United Kingdom3
| Size decile (smallest to largest) | Annual return |
|---|---|
| 1 | 21,6% |
| 2 | 17,7% |
| 3 | 17,0% |
| 4 | 15,6% |
| 5 | 14,7% |
| 6 | 13,7% |
| 7 | 13,1% |
| 8 | 13,2% |
| 9 | 13,3% |
| 10 | 11,4% |
Table 3 – Returns by quintile according to firm size, 1966-1983, Japan4
| Size quintile (smallest to largest) | Annual return |
|---|---|
| 1 | 24,4% |
| 2 | 18,0% |
| 3 | 16,6% |
| 4 | 14,0% |
| 5 | 13,7% |
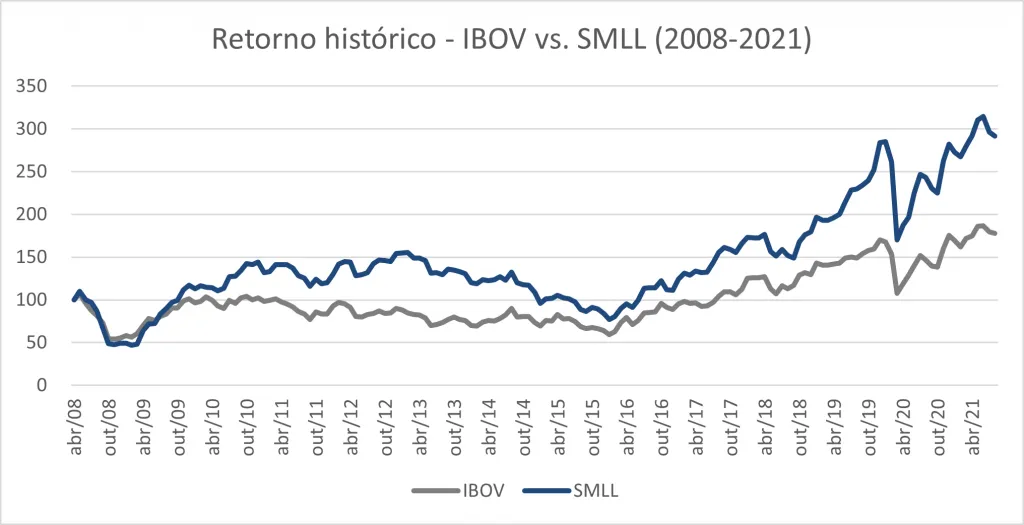
The above results hold true even in Brazil. The chart below shows the returns of the SMLL index compared to the Ibovespa for the period from April 2008 to August 2021. The results show that over this period, the SMLL significantly outperformed the Ibovespa, with a 2.92x appreciation (8.4% per year annual return), compared to 1.78x for the main Brazilian stock market index (4.4% per year annual return).
Chart 1 – Historical return IBOV vs. SMLL (2008-2021)5
At Ártica, unlike most investors, we have a lot of flexibility to invest in companies of any size on the stock exchange, from small caps even the largest Brazilian companies. And our fund is designed precisely for this. The 90-day redemption period, the fact that a significant portion of the fund's capital belongs to our partners, and the long-term vision of our investors allows us to have greater tolerance for investing in small caps.
This wider range of options has allowed us to find excellent opportunities overlooked by the market, which have been fundamental to our historical returns. We hope to continue finding these hidden gems in the stock market! In the next letter, we will discuss a specific case of small cap which is a relevant part of our portfolio today.
1 The SMLL index is composed of companies that meet minimum liquidity criteria and are classified outside the list of those that represent 85% of the market value of all companies listed on the spot market.
2 The results in the table reflect the study carried out by Rolf Banz in 1981 updated to 2012 by Jeremy Siegel in his book “Stocks for the long run”
3 Study conducted by Mario Levis, Professor at the University of Bath, UK and John Moxon
4 “The Size Effect and Seasonality in Japanese Stock Returns,” Nomura Research Institute, 1984. Conducted by T. Nakamura and N. Terada
5 Source: B3; Arctic Analysis