
The 1% per month target trap
Dear investors,
In Brazil, everyone from beginner investors to high-net-worth families believes that 1% per month is a good return target and adopts a strategy of seeking this return with the lowest possible risk. Thus, when interest rates are above 12% per year, fixed income is the preferred asset class for most investors, who understand there is no reason to take greater risks in search of additional returns. Once the base rate falls below 1% per month, they begin to explore alternative asset classes and allocate part of their portfolio to investments with sufficient return potential to, together with their fixed-income portfolio, achieve the desired 1% per month again.
This strategy of using a fixed rate of return as a benchmark for increasing or reducing fixed-income allocation is so common and intuitive that we see few questions about its rationale. However, that's what we'll do here. We'll analyze whether it's truly a good rule of thumb for investing, whether there isn't something more efficient, and we'll present a more generic conceptual model that helps better reflect on return and risk in investments.
Where does the 1% per month target come from?
Over the past 20 years, the average SELIC rate, the benchmark return for Brazilian fixed-income securities, has been close to 11% per year. This has led to the general assumption that 1% per month is the typical return achieved by investing in fixed income securities in Brazil. However, the chart below clearly illustrates the problem with assuming this rate as a fixed return target.
History of the SELIC rate in Brazil

Source: BACEN
The rate has fluctuated significantly over the period and has recently been at lower levels. Furthermore, note that the SELIC is a nominal rate of return, which includes a significant portion of inflation. The typical expectation is that about half of the rate is related to inflation and the other half to real returns, but by breaking down historical rates into these two factors, it becomes clear how crude this assumption is. The real return, which truly matters for investments, is even more volatile than the SELIC.
SELIC history broken down into inflation and real interest rates
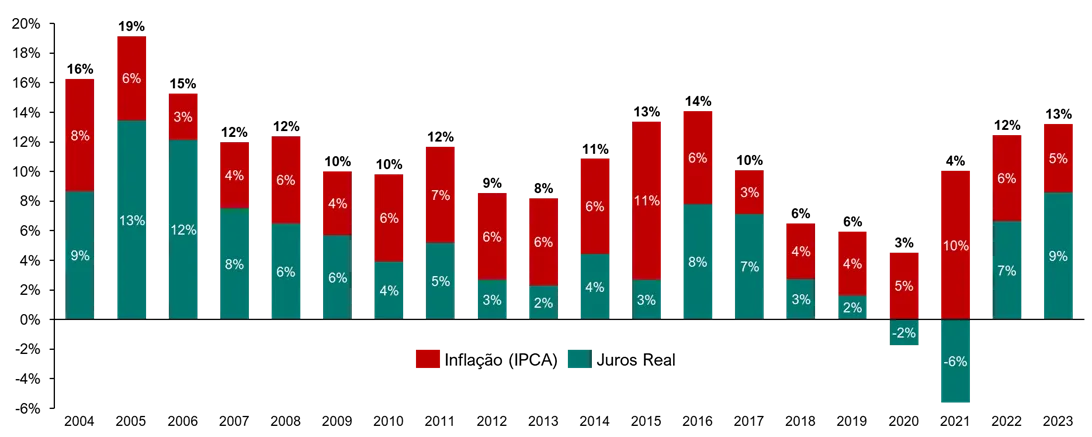
Source: BACEN, IBGE
The best “rule of thumb” for the Brazilian investor
Even though there is significant variation around the 12% average return, the important thing is to assess whether the intuitive rule of investing in fixed income when interest rates are above a certain rate and in the stock market when interest rates are below it is a sound strategy. To do this, we will simulate the return of a portfolio that follows a very simplified rule: when the target SELIC rate¹ is equal to or greater than 12%, the entire investment will be invested in fixed income, and when the target is below 12%, the entire capital will be invested in equities. We will use typical benchmarks as a reference for returns: CDI for fixed income and IBOV for equities. The chart below shows how the allocation would look between January 2004 and March 2024, a little over 20 years.
Strategy 1: Fixed Income when the interest rate is greater than or equal to 12% per annum
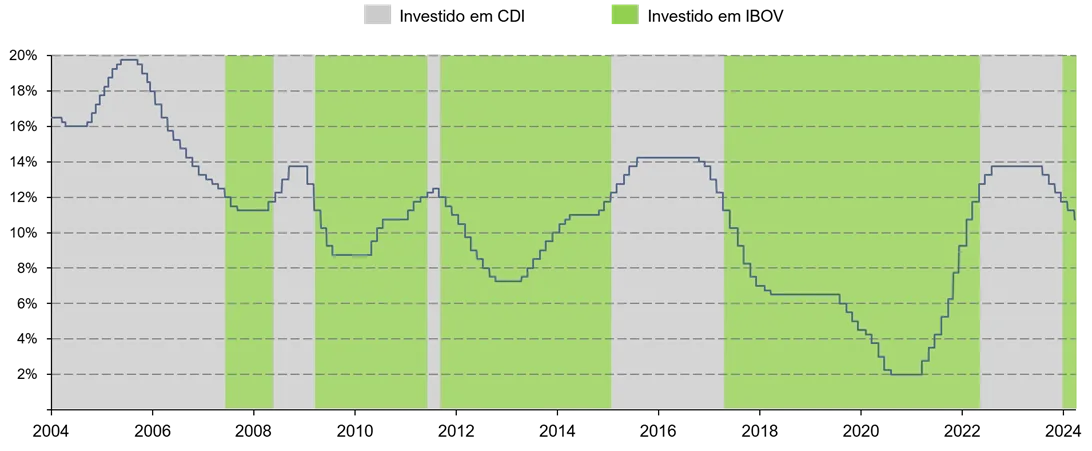
With this strategy, an investor would achieve an average annual return of 11.8% per year, above the individual returns of both the CDI, which yielded 10.7% per year during the period, and the IBOV, which yielded 9.0% per year. In other words, this intuitive and empirical rule doesn't seem entirely bad at first glance. However, there is no clear rationale for using a fixed nominal rate as a reference in allocation decisions or for 12% being the best value for this rate. In fact, over the period considered, the best value would be 11.4%, which would lead to a return of 12.5% per year. If we adopted 10% or 13% as the cutoff line to change the allocation in this strategy, the return would already be lower than the CDI. The sensitivity of the return to the exact rate used as a reference indicates the anecdotal nature of these results and the problem of adopting unfounded rules. Therefore, it is advisable to look for a more efficient rule, while still requiring that it be simple and practical enough for any investor to adopt.
The relationship between interest rates and equity is well known. The higher the interest rates, the lower the stock price should be, for two main reasons: i) high interest rates hinder economic growth, and ii) equity investors demand an expected rate of return equivalent to the prime rate plus a return premium that compensates for the additional risk of the investment. Therefore, even if a company is capable of generating exactly the same cash flow regardless of the interest rate, this investor will accept paying a lower price for that company's shares when interest rates are high. Thus, the most effective strategy would be to invest in equity when interest rates are at their highest and return to fixed income when interest rates are at their lowest. The problem is that peak and trough interest rates are not easy to predict, making this strategy difficult to implement in practice.
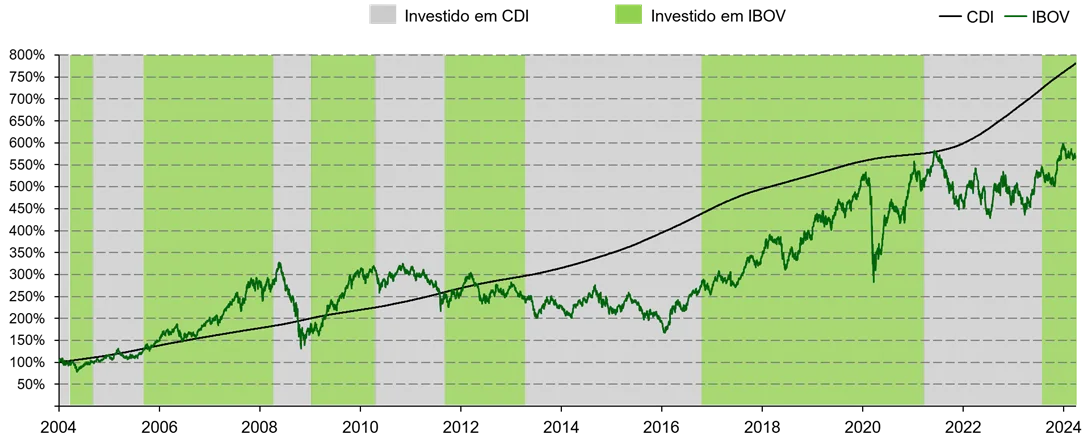
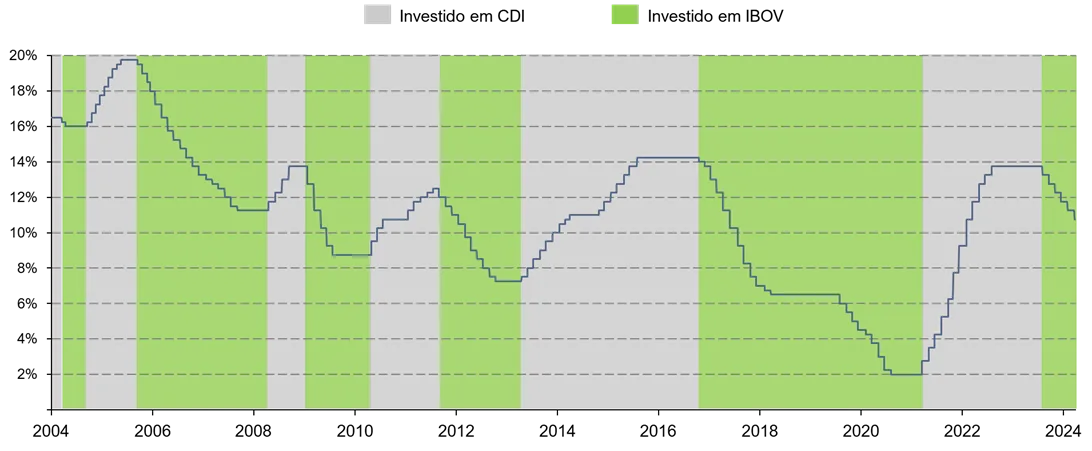
Interest rate hikes and declines, however, tend to be less erratic than stock market movements, as they are guided by monetary policies defined by the Central Bank. The exact timing of interest rate hikes or cuts and the final rate they will lead to remain uncertain, but the Central Bank acts in a planned manner and usually discloses its intentions so the market can adjust its expectations. Thus, we can adopt a fairly simple strategy that makes more conceptual sense than the first: invest in fixed income when interest rates begin to rise and invest in the stock market when interest rates begin to fall again. Using the same simplified rules we used in the previous simulation, the allocation of this second strategy is shown in the chart below.
Strategy 2: Fixed Income when interest rates rise and Variable Income when interest rates fall
This strategy would have generated an average annual return of 16.3% per year, considerably higher than the result of an allocation based on the fixed interest rate benchmark. In summary, these are the simulation results:
Return Comparison of Strategies 1 and 2 vs. Benchmarks
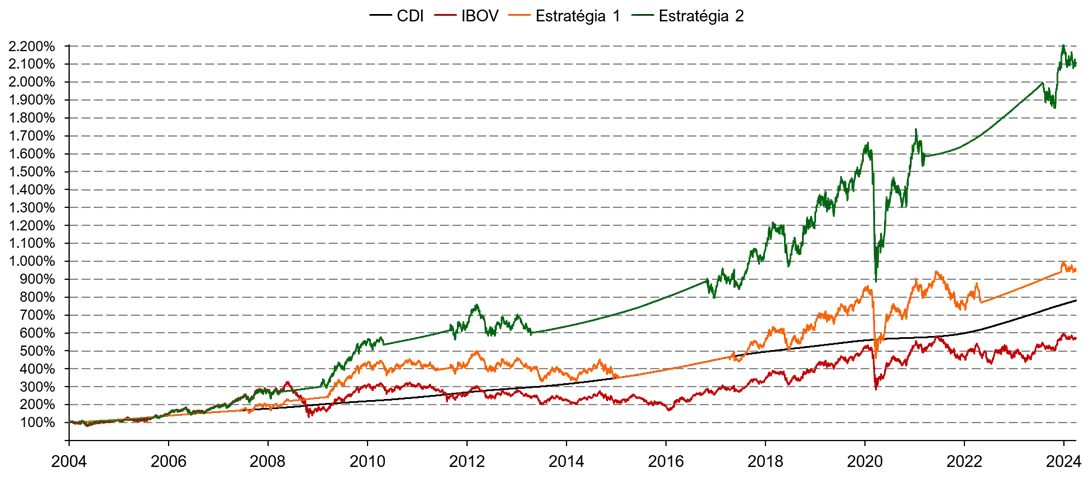
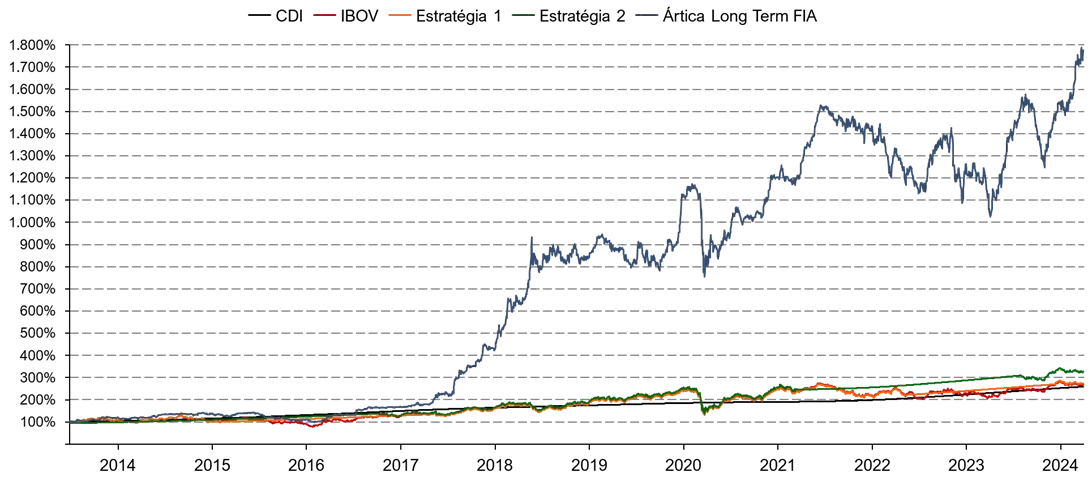
We also emphasize how investing in equities can lead to substantially higher returns than simply keeping all assets allocated to fixed income, even in this analysis where we use the IBOV as a benchmark for equities returns. The index doesn't reveal the full potential of stock market investments, as it assumes a completely passive strategy, meaning it doesn't involve any effort to select the best stocks to invest in. An example of the impact that choosing wisely which stocks to buy can have is the result of Ártica Long Term FIA itself, which had an average annual return of 30.5% per year (21.6% per year above inflation) over nearly 11 years, between June 2013 and March 2024².
Arctic Long Term FIA Return Comparison
Now, let's look for a conceptual framework for dealing with investment decisions that is generic enough to encompass different risk and return profiles, going beyond our simplistic scenario in which we consider only the CDI and IBOV.
How to think about return and risk
When developing an investment strategy, you can approach the issue of risk and return in several ways: you can set a risk level and seek the highest possible return, set a desired return target and seek the lowest possible risk, or set neither variable and always seek the best return-to-risk ratio available in the market. However, it's not clear which is the best approach.
A starting point that simplifies the problem is understanding that there is a maximum level of risk a prudent investor should be willing to take, regardless of the associated return potential. For example, an opportunity that offers a 50% chance of multiplying the invested amount by 5 and a 50% chance of ending up worth zero has an extremely favorable risk-return ratio, but it would be quite unwise to allocate all your assets to it and take on the significant risk of bankruptcy. Therefore, the first step is to determine the limit of risk you can (and are willing to) take on in your investments. A simple way to think about this is to determine how much of your invested capital you need to preserve your lifestyle. This portion should be preserved even in investment stress scenarios.
The second point to consider is that the relationship between risk and return is not always the same over time. There are times when the market offers attractive returns for those willing to take more risk, and times when these additional risks are poorly rewarded. Therefore, setting a target rate of return will lead to a consistently suboptimal investment strategy. The graphs below help understand this rationale.
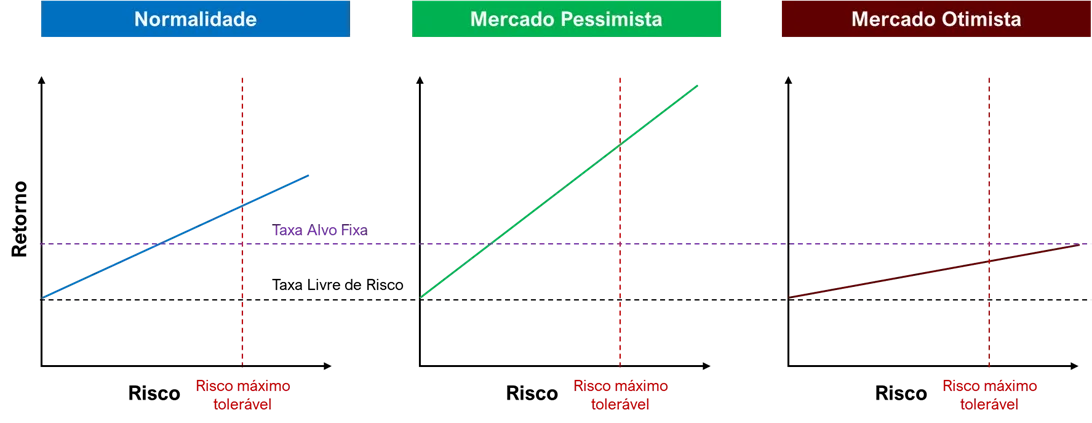
Under normal market conditions, it is reasonable to consider that the increase in return offered as an investor accepts higher levels of risk is adequate. Thus, the target return will depend primarily on the level of risk the investor is willing to assume, respecting the maximum tolerable risk. The problem with considering this target return, established under normal conditions, as a fixed target rate is that it becomes inadequate at the extremes of economic cycles.
In downturns, when the macro environment is unfavorable, interest rates are high, and the market is pessimistic, most investors avoid riskier asset classes. Consequently, the return premium for each increment of risk increases. In this situation, it would be appropriate to seek higher returns, as the same level of risk the investor was willing to take under normal circumstances would already lead to a higher target rate of return. In fact, it may be beneficial to move closer to the maximum tolerable risk at this point, as this is when taking on additional risk offers the greatest benefits.
In bull cycles, when the economy is doing well, interest rates are low, and the market is euphoric, investor optimism leads them to accept lower return premiums for risky investments. In such scenarios, achieving the target rate defined under normal conditions could require accepting a higher level of risk than the maximum tolerable. This is the time when investors should not seek return, but rather safety, as this is when additional risks are poorly rewarded.
Em suma, a melhor estratégia não é determinar uma taxa de retorno alvo fixa, pois isso leva a se acomodar em renda fixa quando os juros estão altos – e, geralmente, há grandes oportunidades no mercado – e a buscar alternativas de investimento justamente quando correr riscos é pouco rentável. O ideal é buscar sempre a melhor relação entre retorno e risco dentro do espectro de oportunidades que não ultrapasse o nível de risco máximo tolerável. De modo geral, isso significa investir em classes de ativos de maior risco, como renda variável, quando o mercado estiver pessimista e os juros estiverem altos e voltar para as classes mais conservadoras, como renda fixa pós fixada, quando o mercado estiver otimista e os juros estiverem baixos. Pode parecer contraintuitivo por ser o inverso do que a maioria dos investidores faz, mas lembre-se que é dos erros da maioria dos investidores que vem os retornos extras da minoria de investidores muito bem-sucedidos. Conselhos de diversos grandes investidores ecoam o mesmo conceito:
“Be fearful when others are greedy and greedy when others are fearful.” – Warren Buffett
“When the world only wants to buy treasury bonds, you can almost close your eyes and buy stocks.” – Michael Steinhardt
“The best time to buy a house is when no one else wants one.” – John Maynard Keynes
1We adopted the SELIC target instead of the effective SELIC because both rates are very close and the SELIC target has the advantage of having a fixed value for each period, determined by COPOM.
2Ártica Long Term started on 06/27/2013 as an investment club and was transformed into an Equity Investment Fund on 09/27/2019