In addition to the impacts on global economies, major financial crises have significant repercussions on the stock market, generating volatility and uncertainty for investors.
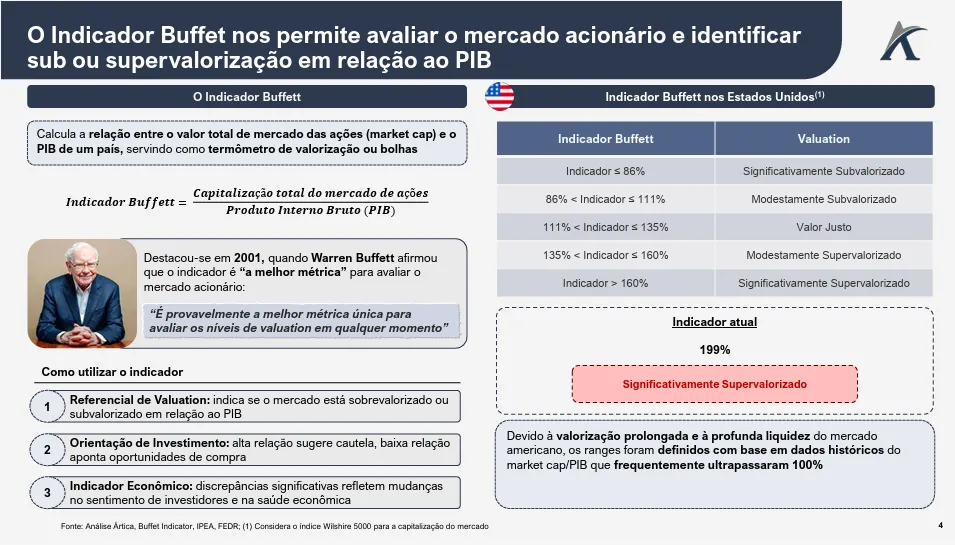
The drivers of these crises can be varied, from banking collapses to external shocks, and one indicator that helps measure the magnitude of these effects is the Buffett Indicator, which relates the total value of the stock market to a country's GDP.
Many people use this financial thermometer to try to anticipate upward movements or speculative bubbles; however, its results can fluctuate significantly depending on the degree of economic maturity, the depth of the financial market, and the monetary policy adopted in each country.
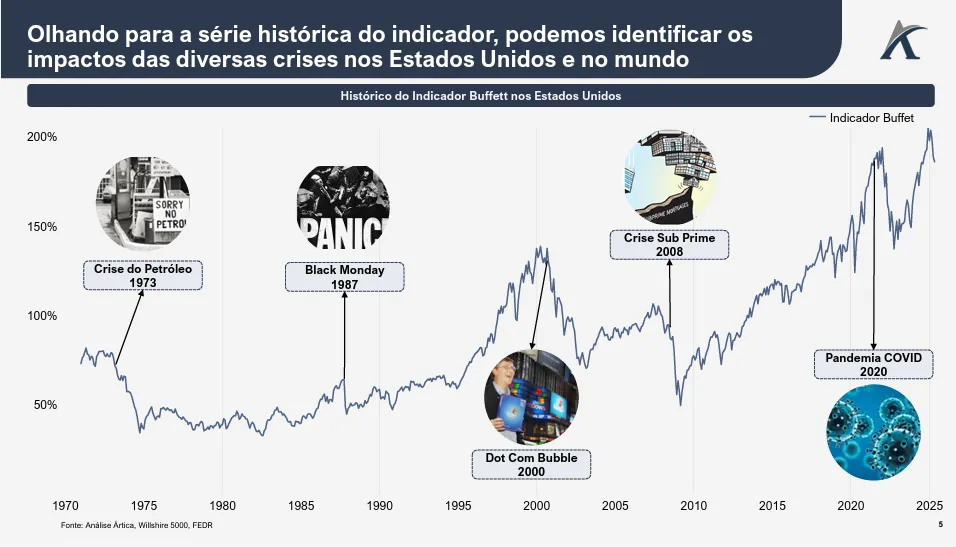
Therefore, it is particularly interesting to examine the historical series of the Buffett Indicator in the United States and its evolution in the face of the major financial crises that have occurred over time, investigating how its peaks and declines may have signaled moments of overvaluation or anticipated periods of market turbulence.