Dear investors,
Considering the turbulent scenario we live in, we have dedicated the last few letters to bring a historical perspective on stock investments.
We have already written two letters on the subject, the first addressed the issue of investments in times of crisis, and the second compared the historical return of shares vs. fixed income in several countries.
In this letter, we deepen the theme and bring an analysis focused on the Brazilian market.
It is common to hear news and comments from analysts criticizing investments in Brazil. The problems mentioned are well known: political instability, fiscal deficits, historically high inflation (despite being controlled in recent years), decades of low economic growth, among others.
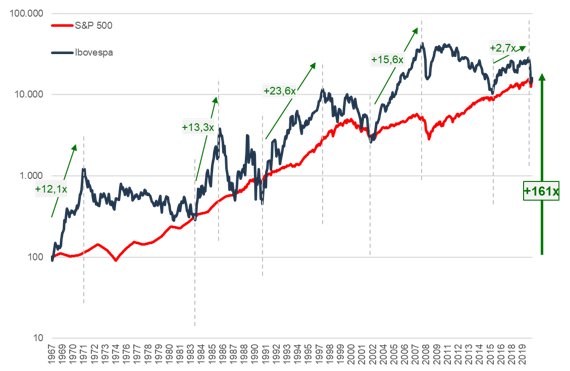
Despite all these problems, the Brazilian stock exchange has a great return history. Since the creation of the Ibovespa, in Jan/1968, until May/2020 (in the midst of the Covid-19 crisis), the Ibovespa has had a return of 161 times in dollars (equivalent to an annual rate of 10.2% pa), compared 148 times the S&P 500 (10.0% pa) over the same period. The return of the Brazilian index is higher than the American one even when we include the year 2020, which has been terrible for the Ibovespa (return of -43% vs. -5% of the S&P 500, both in dollars).
These results are shown in Graph 1 below, which shows a history of the Ibovespa marked by cycles of decline accompanied by periods of extraordinary appreciation.
Graph 1 – Historical return of Ibovespa vs S&P 500 in Dollars [1]

This result seems counterintuitive, particularly when considering our turbulent political and economic history. Since the creation of the index in 1968, Brazil has lived through a military dictatorship, two impeachments, experimented with 7 different currencies and has gone through numerous economic crises. During this period, the country certainly had an economic growth below its potential, so how can this result be justified?
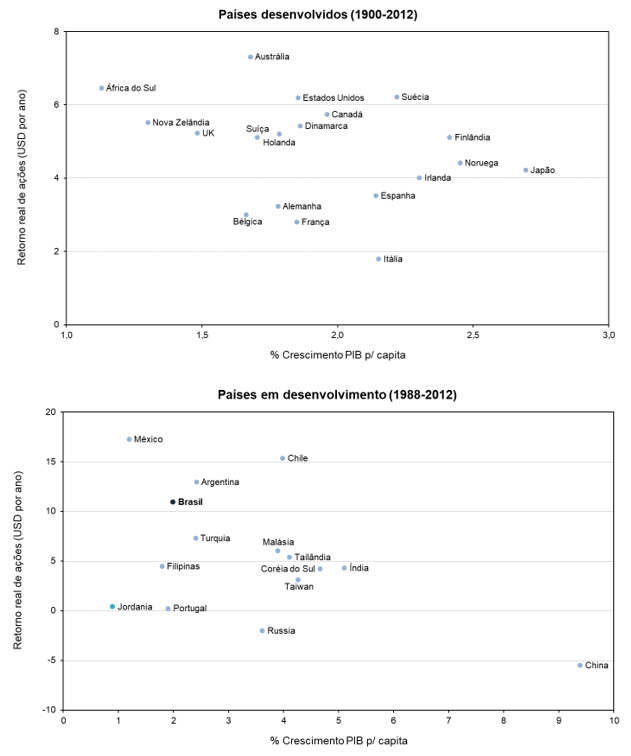
Contrary to common opinion, economic growth of a specific country has little to do with the performance of its stock market, especially considering that we live in a globalized economy where the most important thing is global economic growth. Data from 34 countries collected over a period of 112 years (1900-2012) for developed countries and 24 years (1988-2012) for developing countries show a surprising result: low correlation between economic growth and stock market appreciation.
Brazil, for example, is one of the countries that presented the best return in this period despite weak economic growth.
Graph 2 – Stock Return vs. economic growth [2]

Why does it happen?
There are three hypotheses to explain this trend:
1. In the globalized world we live in, the stock index of many countries has a relevant presence of multinationals or exporting companies whose results are more linked to the performance of the global economy than the local one.
In the Brazilian case, 37% of the Ibovespa index is composed of companies linked to commodities (Petrobras, Vale, Suzano, Klabin), industrial exporters (Embraer, Weg), or with relevant international subsidiaries (Ambev, JBS, Natura, Gerdau).
2. In many countries, the capital market is poorly developed and there are a limited number of companies whose shares are traded on the respective exchanges. Such companies do not necessarily reflect the general performance of the economy. Furthermore, due to their size, such companies often have significant competitive advantages vs. its smaller competitors and manage to obtain higher than average rates of return on invested capital, which contributes to a higher return on the stock market.
3. As with individual stocks, higher growth is not necessarily linked to higher returns as expectations are often built into stock prices through higher multiples.
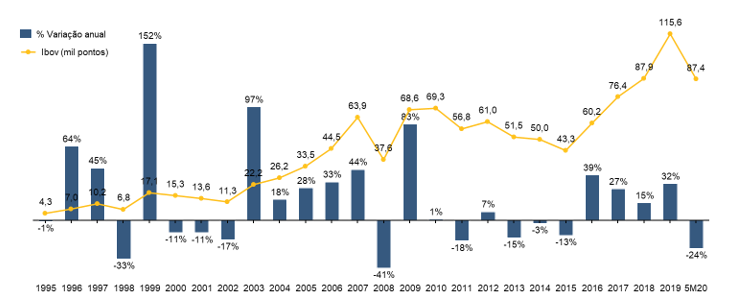
It is worth reflecting here on the importance of the long term for investing in stocks. Despite the great historical result, the Ibovespa is an index with a history of high volatility, where years of strong declines were followed by years of exceptional gains. This result can be seen in Graph 1 and is also illustrated by the following graph:
Graph 3 – Annual and accumulated return of the Ibovespa, in reais (1995-2020) [3]

An investor who had sold his shares in 2002, disappointed with the market's performance, would have missed a great earnings opportunity that was presented between 2003 and 2007. The same happened in 2008, 2015 – who knows, it might be the case in 2020?
Knowing the volatility of the Ibovespa, investors might wonder whether a “time the market” investment strategy would make sense, that is, investing in stocks when the market is down and selling when the market is up. Despite making theoretical sense, the problem with this strategy is that no one knows which direction the market is going, whether it will go up or down, and waiting for the ideal moment to enter can generate a huge opportunity cost.
Research carried out in the United States comparing the estimate of appreciation of the S&P 500 made by market analysts with what actually happened shows large distortions in almost every year. Some examples: in 2008, the estimate was for an appreciation of 16%; what happened: drop of 37%. In 2013, estimate was of lean recovery of 3%; result: appreciation of 32%.
The point here is not to criticize the work of analysts, but to show that, in the short term, the stock market is unpredictable. Therefore, we believe that the best strategy is to always be invested and, therefore, enjoy the long-term benefits that shares provide.
[1] Source: Arctic Analysis; Data presented for the period between Jan/68 (beginning of Ibovespa) and May/20; S&P considering dividend reinvestment (SP500TR), whose data are presented annually between 1968-88, and monthly from 1988 [2] Source: Stocks for the Long Run, Jeremy J. Siegel (2014) [3] Source: Arctic Analysis

