

Dear investors,
The concern with a possible return of inflation has grown all over the world. In Brazil it is no different: inflation expectations for 2021 have consistently increased in recent weeks. The latest Focus bulletin already points to an IPCA expectation of 4.85% in 2021 (compared to 3.32% at the beginning of the year) and, in an attempt to get around the situation, the Central Bank increased the Selic from 2.0% to 2.75% in last cycle. Economists still expect new rounds of interest rate hikes by the end of the year. These levels of interest and inflation are still much lower than what we have experienced in Brazil for many years, but perhaps precisely because of our history, any indication of a return to inflation is viewed with concern. In view of this scenario, in this report we sought to present how stocks behave in inflationary environments, based on historical evidence that supports our vision.
In the chart below, we once again bring an analysis that we presented in our May/2020 letter (“Equities vs. Fixed Income – Part 1”), which shows the return of several asset classes in the US market in the very long term. The chart presents the inflation-adjusted historical return over the period 1800-2012.
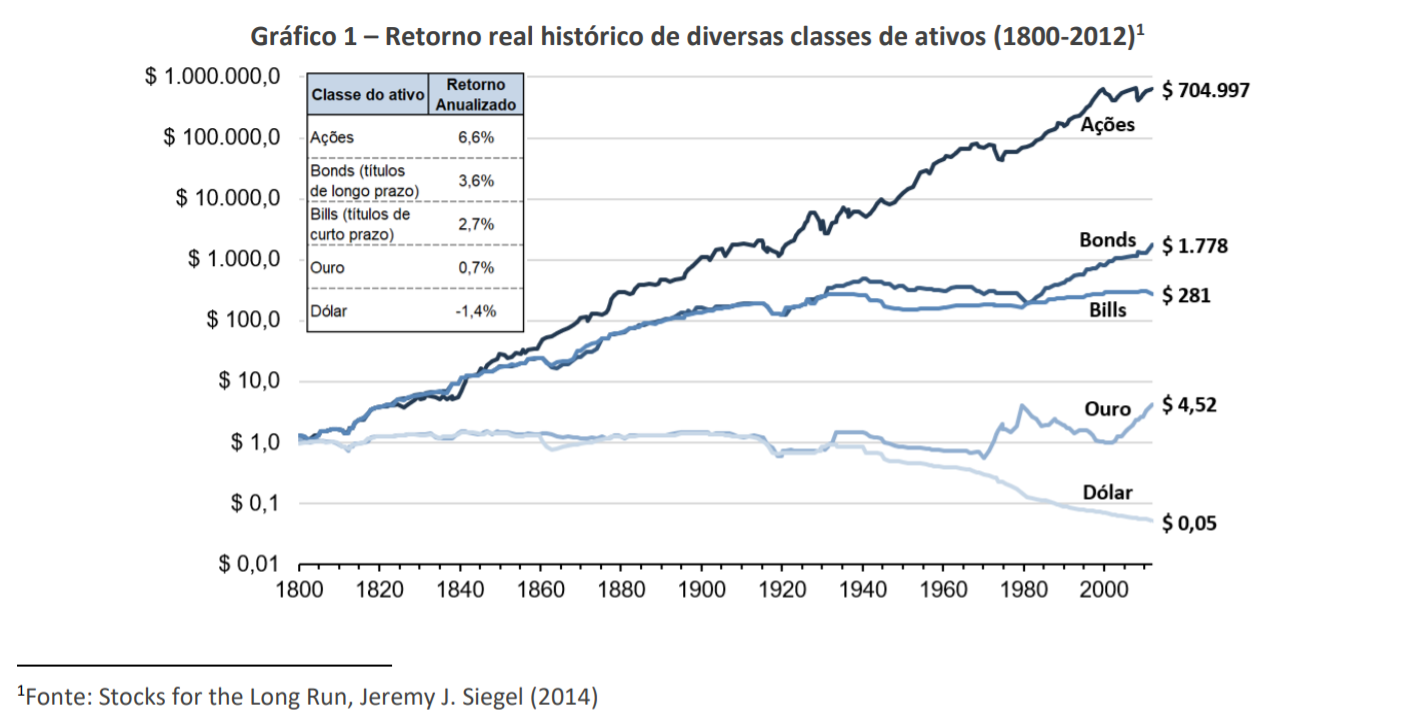
The chart illustrates how stock returns are remarkably stable over the very long term, growing almost in a straight line (logarithmic scale) with small fluctuations over time.
What is interesting to note from the graph is that the analysis can be divided into two periods that are quite different in terms of inflation. Until the 1930s, the price level in the US was about the same as in the 1800s (there was no inflation for a period of 130 years!), and since then, price levels have risen steadily, with inflation at every year. Even in such different scenarios in terms of inflation, the real return on stocks was practically the same in both periods.
Graph 2 below shows cumulative inflation in the US over time.
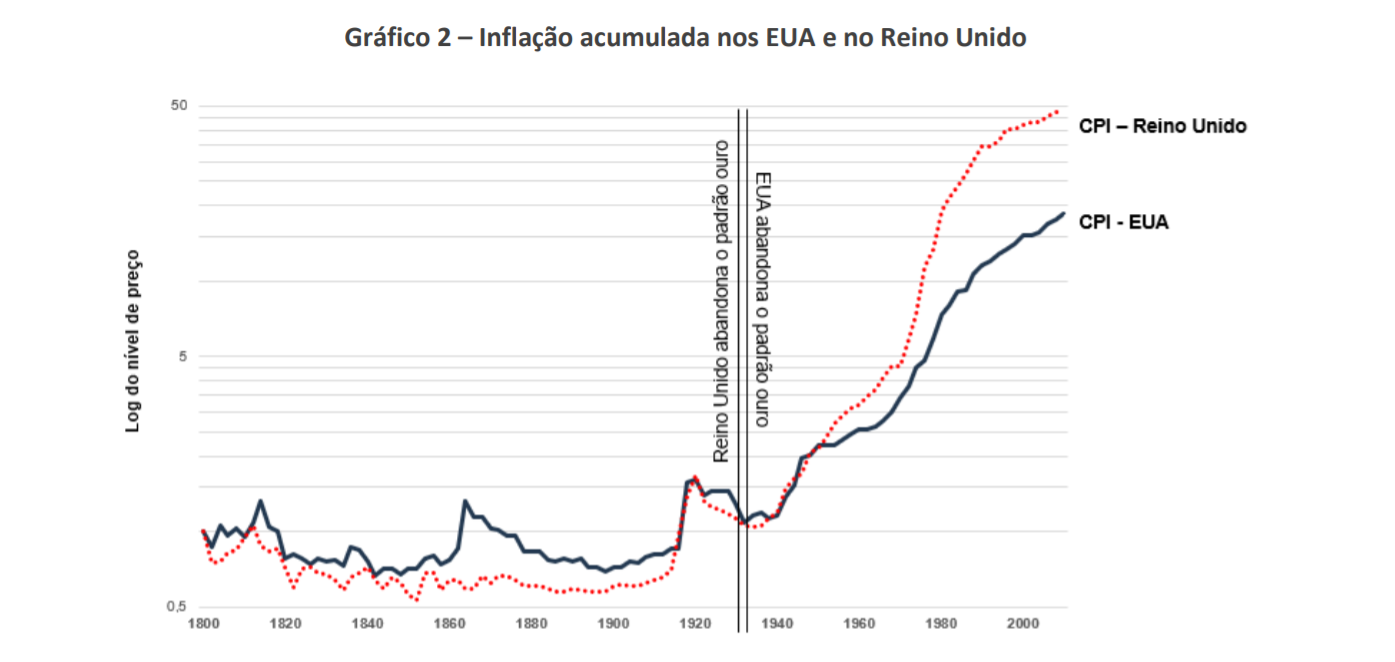
The reason that led to this brutal change in inflation was the end of the adoption of the gold standard by the United States and United Kingdom, which gave flexibility to central banks to increase the money supply in the economy. This greater flexibility brings some benefits as it enables stimulating monetary policies in crisis environments, but on the other hand it also carries the risk of inflation. Graph 1 also shows this effect because, until the 1930s, the value of gold and the dollar were closely linked. That connection has since ceased to occur.
Why do stocks perform well under different inflation scenarios?
Stocks represent shares in companies, and the value of such companies is linked to the price of the goods and services they offer. Since the rise in price of such goods and services is what compounds inflation, stocks are naturally hedged against inflation.
Evidence shows that this finding holds true in the long term, but not in the short term. The charts below present real stock returns in different inflation environments, in two scenarios: (1) long-term (30-year investment period) and (2) short-term (1-year investment period).
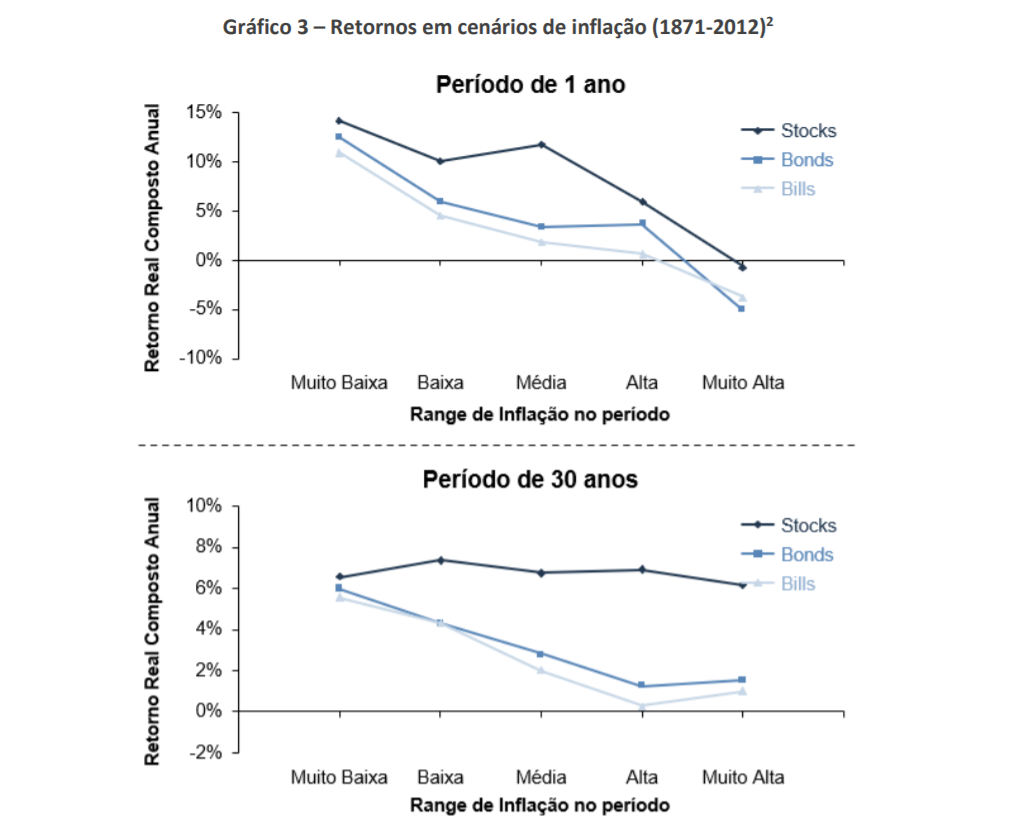
There are some reasons that explain this poor performance in the short term. One is that, with higher inflation, there is an expectation of interest rate hikes by central banks, which in turn is usually followed by an economic slowdown and a consequent devaluation of stocks.
Another important reason is that, in many situations, price increases do not spread simultaneously across all sectors, harming the performance of companies with greater difficulties in passing on their prices.
An example was the oil shock in the 1970s. At the time, due to supply restrictions in the OPEC countries, commodity prices more than tripled in a few months. This increase pressured the costs and margins of many companies that took years to pass on the price increase to their consumers, which consequently pressured their market value.
This situation leads us to an important conclusion: companies with pricing power are naturally protected in inflation scenarios, as they are able to absorb cost increases more easily.
²Source: Stocks for the Long Run, Jeremy J. Siegel (2014)
What does the evidence show for Brazil?
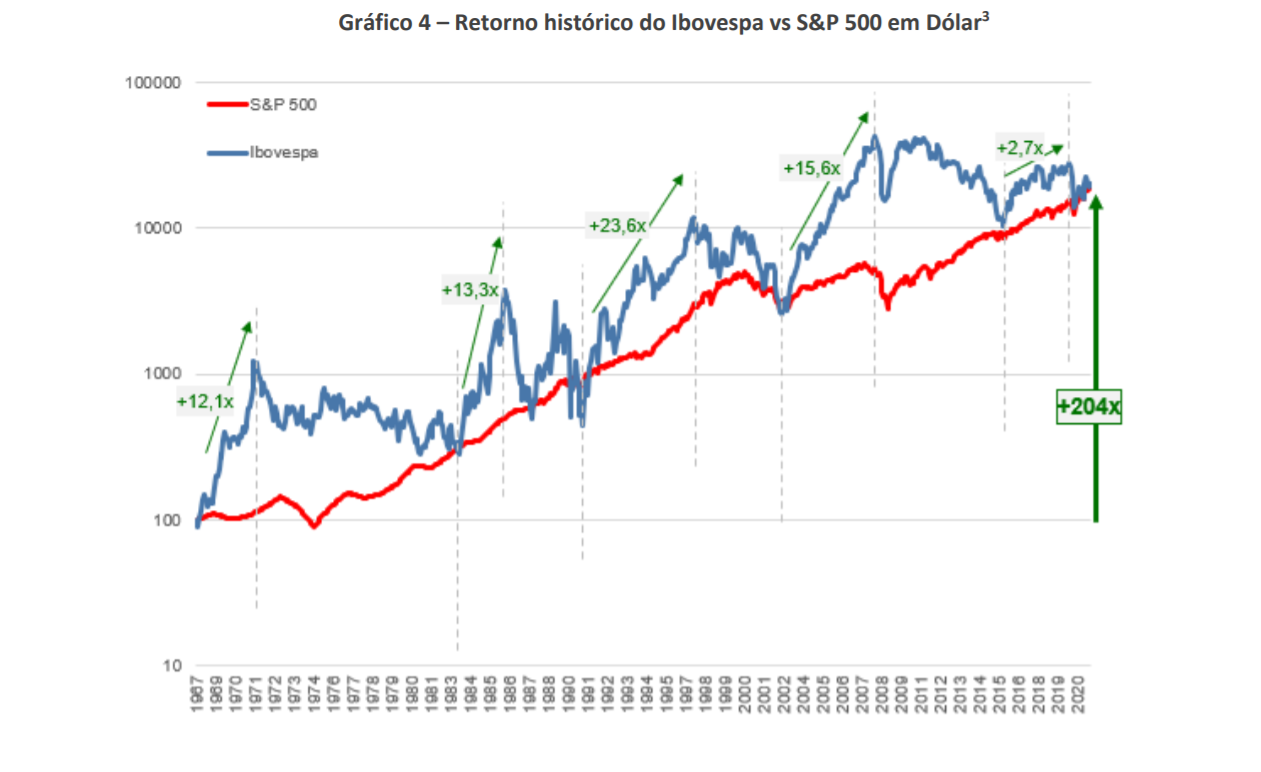
As in the United States, equity investments in Brazil have historically been quite profitable, albeit much more volatile. This level of profitability was obtained even with a past of hyperinflation for many years.
Since the creation of the Ibovespa, in Jan/1968, until Mar/2021, the Ibovespa had a real return (above inflation) in dollars of 26.3 times (equivalent to an annual rate of 6.33% pa), compared to 25. 3 times the S&P 500 (6.26% aa) over the same period.
At Ártica, we focus our investments on great businesses, and one of the defining characteristics of such businesses is the ability to pass through prices in the most adverse environments. This selection criterion, combined with our long-term focus, is how we seek to protect ourselves from inflation.
³Source: Arctic Analysis; Data presented for the period between Jan/68 (beginning of Ibovespa) and Mar/21; S&P considering dividend reinvestment (SP500TR), whose data are presented annually between 1968-88, and monthly from 1988