Dear investors,
In Brazil, from beginner investors to high net worth families believe that 1% per month is a good profitability target and adopt the strategy of seeking this return with the lowest possible risk. Therefore, when interest rates are above 12% per year, fixed income is the asset class preferred by most investors, who understand that there is no reason to take greater risks in search of extra returns. From the moment the basic rate falls below 1% per month, they begin to explore alternative asset classes and allocate part of their portfolio to investments with sufficient return potential to, together with their fixed income portfolio, seek the targeted 1% per month again.
This strategy of using a fixed rate of return as a reference to increase or reduce fixed income allocation is so common and intuitive that we see few questions about its rationality. However, that is what we will do here. We will analyze whether it really is a good rule of thumb for investing, whether there is something more efficient and we will bring a more generic conceptual model, which helps to better reflect on return and risk in investments.
Where does the target of 1% per month come from?
Over the last 20 years, the average SELIC, the return reference for Brazilian fixed income securities, was close to 11% per year. With this, the general reference was formed that 1% per month is the return that can typically be obtained by investing in fixed income in Brazil. However, the graph below already illustrates the problem of assuming this rate as a fixed return target.
History of the SELIC rate in Brazil

Source: BACEN
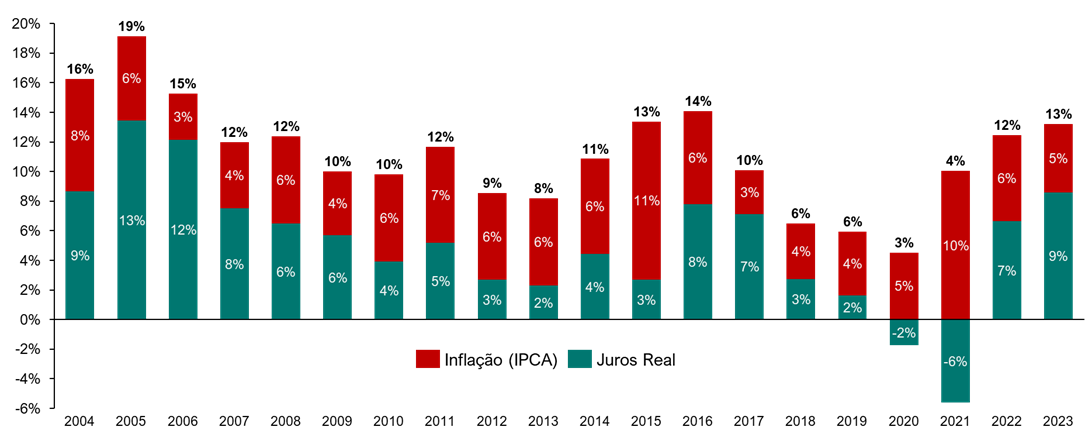
The rate fluctuated a lot over the period and has recently been at lower levels. Furthermore, note that SELIC is a nominal rate of return, which contains a relevant portion of inflation. The typical expectation is that about half of the rate is relative to inflation and the other half is relative to real returns, but breaking down the historical rates between these two factors, it becomes clear how crude this assumption is. The real return, what truly matters for investments, is even more volatile than the SELIC.
SELIC history decomposed between inflation and real interest
Source: BACEN, IBGE
The best “pocket rule” for the Brazilian investor
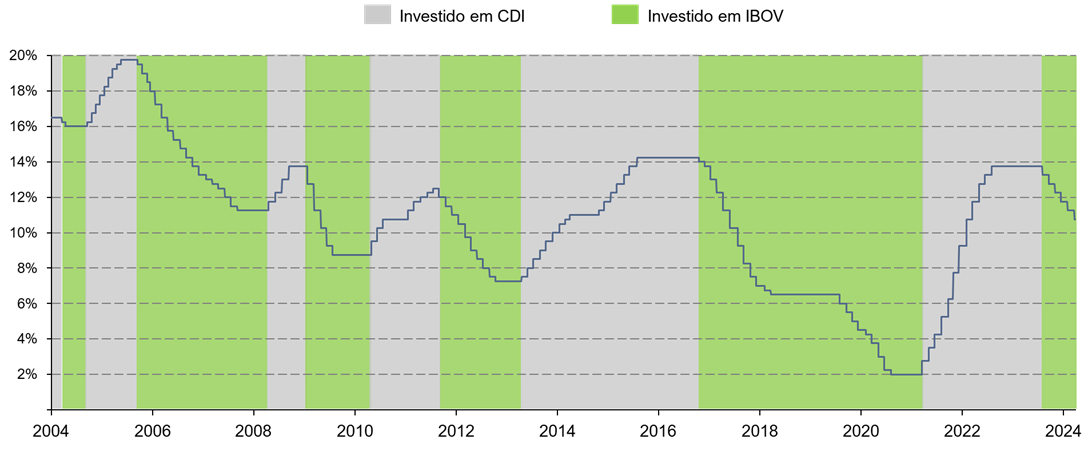
Even if there is a relevant variation around the 12% average return, what is important is to evaluate whether the intuitive rule of investing in fixed income when interest rates are above a certain rate and in the stock market when interest rates are below it is a good strategy. . To do this, we will simulate the return of a portfolio that follows a very simplified rule: when the target for the SELIC¹ rate is equal to or greater than 12%, the entire investment will be invested in fixed income and, when the target is below 12%, the entire capital will be invested in variable income. We will adopt typical benchmarks as a return reference: CDI for fixed income and IBOV for variable income. The graph below shows what the allocation would look like in the period between January 2004 and March 2024, just over 20 years.
Strategy 1: Fixed Income when interest rate is greater than or equal to 12% pa
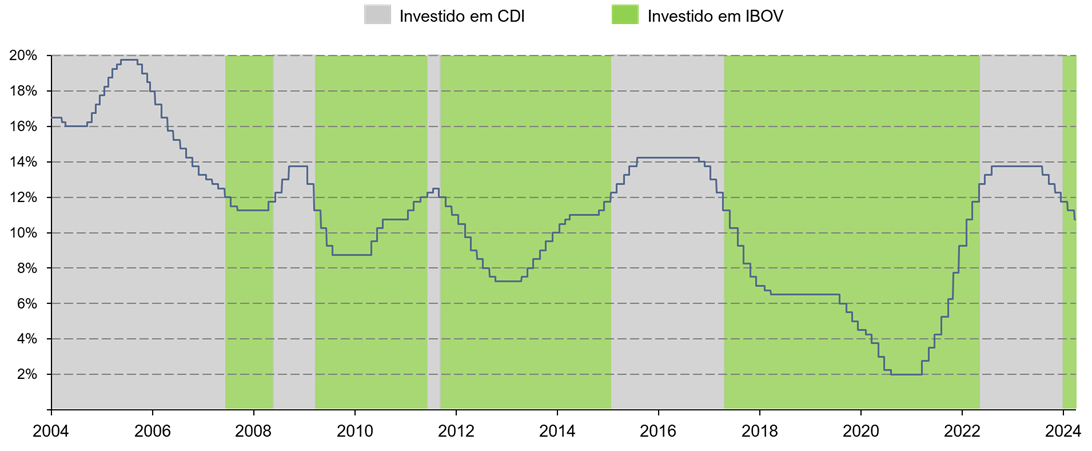
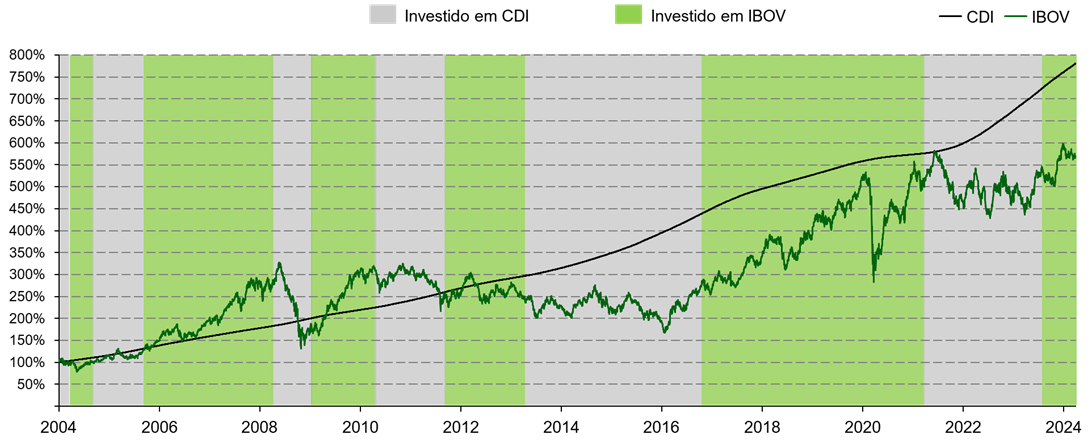
With this strategy, an investor would achieve an average annual return of 11.8% per year, above the isolated returns of both the CDI, which yielded 10.7% per year in the period, and the IBOV, which yielded 9.0% per year. In other words, this intuitive and empirical rule does not seem all bad at first glance. However, there is no clear rationale for using a fixed nominal rate as a reference in allocation decisions or for 12% to be the best value for that rate. In fact, in the period considered, the best value would be 11.4%, which would lead to a return of 12.5% pa. If we adopted 10% or 13% as a cutoff line to change the allocation in this strategy, the return would already be lower than the CDI. The sensitivity of the return to the exact rate used as a reference indicates the casuistic nature of these results and the problem of adopting unfounded rules. Therefore, it is advisable to look for a more efficient rule, whilst still requiring it to be simple and practical enough for any investor to adopt.
The relationship between interest and variable income is well known. The higher the interest rates, the lower the share price should be, for two main reasons: i) high interest rates hinder economic growth and ii) the variable income investor demands an expected rate of return equivalent to the basic interest rate plus a return premium that compensates for the additional risk of the investment, so, even if a company is capable of generating exactly the same cash flow regardless of the interest rate, this investor will accept paying a lower price for the company's shares when interest rates are high. Therefore, the most effective strategy would be to invest in variable income when interest rates are at their maximum level and return to fixed income at the minimum interest level. The problem is that maximum and minimum interest rates are not easy to predict, making this strategy not very implementable in practice.
Rising and falling interest rates, however, tend to be less erratic than stock market movements, as they are guided by monetary policies defined by the Central Bank. The exact schedule of interest rate increases or cuts and what rate they will lead to in their final stage remain uncertain, but the Central Bank acts in a planned manner and usually publicizes its intentions so that the market adjusts its expectations. Thus, we can adopt a very simple strategy that makes more conceptual sense than the first: investing in fixed income when a rise in interest rates begins and investing in the stock market when interest rates begin a new downward trend. With the same simplified rules that we used in the previous simulation, the allocation of this second strategy is shown in the graph below.
Strategy 2: Fixed Income when interest rates rise and Variable Income when interest rates fall
This strategy would have generated an average annual return of 16.3% per year, considerably higher than the result of the allocation made based on the fixed reference for the interest rate. In summary, these are the results of the simulations:
Return comparison of Strategies 1 and 2 x Benchmarks
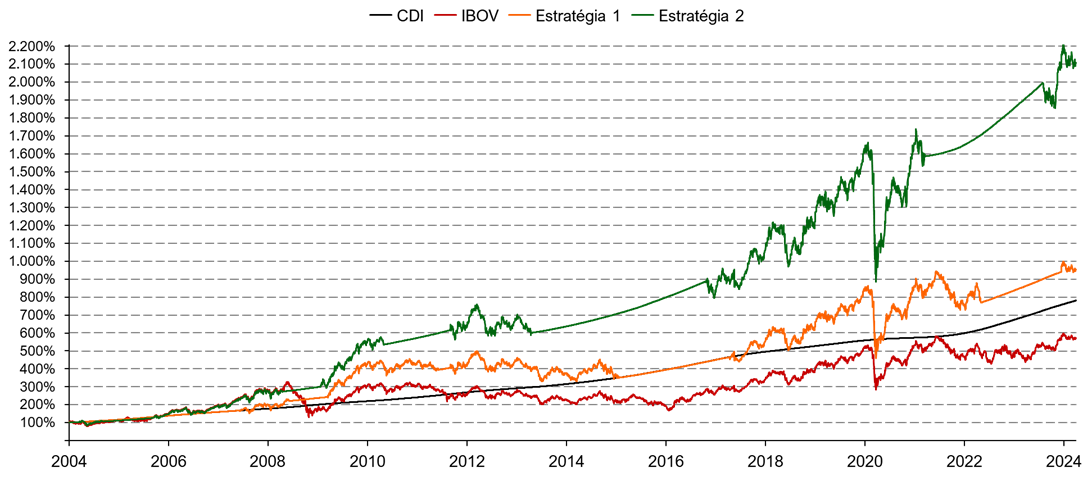
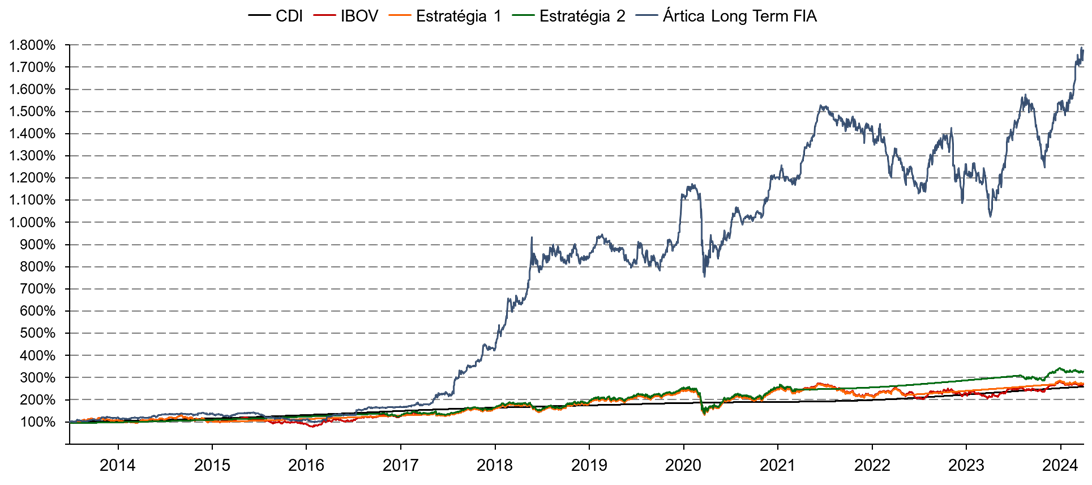
We also highlight how investing in variable income can lead to substantially higher returns than just keeping all the assets allocated in fixed income, even in this analysis in which we use IBOV as a reference for variable income returns. The index does not reveal the full potential of stock market investments, as it assumes a completely passive strategy, that is, it does not involve any effort to select the best shares to invest in. An example of the impact that choosing well which shares to buy can have is the result of Ártica Long Term FIA itself, which had an average annual return of 30.5% pa (21.6% pa above inflation) over almost 11 years, between June 2013 and March 2024².
Ártica Long Term FIA return comparison
Now, let's look for a conceptual framework for dealing with investment decisions that is generic enough to encompass different risk and return profiles, going beyond our simplistic scenario in which we only consider the CDI and IBOV.
How to think about return and risk
When developing an investment strategy, you can approach the issue of risk and return in several ways: you can set the level of risk and seek the highest possible return, set the desired return target and seek the lowest possible risk, or set none of the two variables and always seek the best relationship between return and risk available on the market. However, it is not clear which is the best path.
A starting point that simplifies the problem is to understand that there is a maximum level of risk that a prudent investor should be willing to take, regardless of the associated return potential. For example, an opportunity that offers a 50% chance of multiplying the amount invested by 5 and a 50% chance of ending up worth zero has an extremely favorable return and risk ratio, but it would be quite imprudent to allocate all your assets to it and assume the relevant risk of going bankrupt. Therefore, the first step is to determine the risk limit that you can (and are willing to) take on your investments. A simple way to think about this is to determine how much of your invested capital you need to preserve your lifestyle. This portion should be preserved even in investment stress scenarios.
The second point to consider is that the relationship between risk and return is not always the same over time. There are times when the market offers attractive returns to those willing to take more risks and times when these additional risks are very poorly rewarded. Therefore, fixing the target rate of return will always lead to a sub-optimal investment strategy. The graphs below help to understand this rationale.
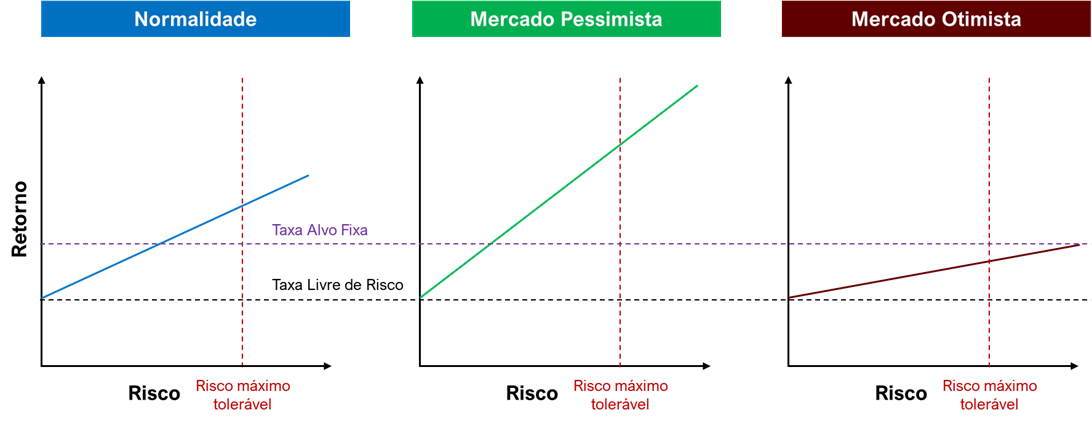
Under normal market conditions, it is reasonable to consider that the increase in return offered as an investor accepts greater levels of risk is adequate. Therefore, the target return will depend mainly on the level of risk that the investor wants to assume, respecting the maximum tolerable risk. The problem with considering this target return, established in normality, as a fixed target rate is that it becomes inappropriate at the extremes of economic cycles.
In down cycles, when the macro environment is unfavorable, interest rates are high and the market is pessimistic, most investors avoid the riskiest asset classes and, as a consequence, the return premium for each increment of risk increases. In this situation, it would be appropriate to seek higher returns, as the same level of risk that the investor was willing to take normally would already lead to a higher target rate of return. In fact, it may be beneficial to get closer to the maximum tolerable risk at this point, as this is when taking extra risks offers the most benefits.
In boom cycles, when the economy is doing well, interest rates are low and the market becomes euphoric, investors' optimism causes them to accept lower return premiums for risky investments. In scenarios like this, reaching the target rate defined in normality could require accepting a risk level higher than the maximum tolerable. This is the time when the investor should not seek returns, but rather security, as this is when extra risks are poorly rewarded.
In short, the best strategy is not to determine a fixed target rate of return, as this leads to settling into fixed income when interest rates are high – and, generally, there are great opportunities in the market – and seeking investment alternatives precisely when they are available. risks is unprofitable. The ideal is to always seek the best relationship between return and risk within the spectrum of opportunities that does not exceed the maximum tolerable risk level. Generally speaking, this means investing in higher risk asset classes, such as variable income, when the market is pessimistic and interest rates are high and returning to more conservative classes, such as post-fixed fixed income, when the market is optimistic and the interest rates are low. It may seem counterintuitive because it is the opposite of what most investors do, but remember that it is from the mistakes of the majority of investors that the extra returns of the minority of very successful investors come from. Advice from several major investors echoes the same concept:
“Be fearful when others are greedy and greedy when others are fearful.” – Warren Buffett
“When the world just wants to buy treasuries, you can almost close your eyes and buy stocks.” – Michael Steinhardt
“The best time to buy a house is when no one else wants one.” – John Maynard Keynes
¹ We adopted the SELIC target instead of the effective SELIC because both rates are very close and the SELIC target has the advantage of having a fixed value for each period, determined by COPOM.
²Ártica Long Term began on 06/27/2013 as an investment club and was transformed into a Stock Investment Fund on 09/27/2019
Check out the comments from Ivan Barboza, manager of Ártica Long Term FIA, about this month's letter in YouTube or in Spotify.

