
The biggest stock market returns since 2005
Dear investors,
Despite significant short-term challenges, the Brazilian stock market is enjoying a magnificent period of returns. Since the beginning of 2016, after falling as much as 38,000 points, the Ibovespa has consistently delivered strong results (26% per year from January 17, 2016, to March 1, 2021, the closing date of this letter). Not even the pandemic, when the stock market went from 118,000 to 67,000 and back to 118,000 in less than a year, was able to halt this trend, which has lasted for more than five years.
What factors contributed most to this return? Faced with this question, we decided to measure the highest returns on the Brazilian stock market since 2005 and investigate which companies provided the best returns for investors. For this analysis, we used the concept of Total Shareholder Return (TSR).
The TSR breaks down the valuation of an asset into 4 components:
- Distribution of proceeds;
- Increase in net profit;
- Expansion of the P/E (Price/Earnings) multiple; and
- Combined effect of items 1, 2 and 3.
In summary:
TSR = dividends + net income increase + P/E expansion + combined effect
While items 1 and 2 are linked to the company's performance, item 3 represents a change in investors' expectations of profit growth.
To illustrate the growth expectation implicit in the expansion of the P/E multiple, suppose an investor buys a stock at a P/E of 50x. Let's also assume that the company experiences a period of high growth for 10 years, during which it would pay only the mandatory minimum of 25% of net income in dividends. After this period of strong growth, its net income stabilizes and it begins distributing 100% of its profit. For the investor to have a real return (above inflation) of 10% per year in the long term, the company's profit would have to grow 28% per year, above inflation, for 10 years! In other words, it would increase by more than 1,000% over the period. If net income does not grow, the fair multiple to achieve the same rate of return would be 10x P/E. In other words, the higher the P/E, the greater the expected growth of the company's net income in the coming years. After all, we imagine that no one would buy an asset and wait 50 years to receive their investment back.
The table below shows the companies that have performed best since 2005:
Table 1 – Highest annual returns on the Brazilian stock market since 20051
| Enterprise | Annualized return | Revenue | Net profit expansion | Multiple expansion | Efeito combinado |
|---|---|---|---|---|---|
| 1 Whirlpool | 31% | 12% | 16% | 1% | 2% |
| 2 Locates | 25% | 2% | 16% | 6% | 1% |
| 3 Comgás | 25% | 10% | 8% | 5% | 2% |
| 4 Espadrilles | 24% | 3% | (1%) | 20% | 1% |
| 5 Renner | 22% | 2% | 17% | 2% | 1% |
| 6 Grazziotin | 22% | 5% | 18% | (2%) | 0% |
| 7 Ferbasa | 20% | 6% | (2%) | 16% | 0% |
| 8 Sanepar | 20% | 7% | 10% | 2% | 1% |
| 9 Coelce | 17% | 8% | 2% | 6% | 1% |
| 10 Safe Harbor | 17% | 5% | 11% | 0% | 1% |
| 11 Sabesp | 16% | 3% | 2% | 10% | 1% |
| 12 Romi | 15% | 5% | 6% | 3% | 1% |
| 13 Engie | 15% | 6% | 8% | 1% | 1% |
| 14 CSN | 15% | 5% | 5% | 4% | 1% |
| 15 Bradespar | 14% | 4% | 1% | 8% | 1% |
Source: Economática, Capital IQ, Arctic Analysis
As we can see, Whirlpool (WHRL4) is the company with the highest annualized profitability during the period, delivering a return of 31% per year since 2005. This return was composed of 12% per year in dividends, 16% per year in net income growth, 1% per year in multiple expansion, and 2% per year from the combined effect. It was a consistent and high-quality return. Whirlpool is a company we know well, having been in our portfolio since 2013.
Another point worth noting is that most returns were primarily composed of net income growth and dividends—the longer the analysis window, the more likely this is to be true. The chart below shows the return composition of the 15 companies listed in the table above:
1 Companies that had negative net income in 2005 or 2020 LTM were excluded from the analysis, as it is not possible to measure their TSR components. Furthermore, a liquidity filter of >R$25,000/day was applied for all years of the analysis. The analysis covers the period from December 29, 2005, to February 26, 2021; therefore, companies that IPOed after this period are not included in the analysis. Some of the companies presented may have suffered non-recurring impacts that inflate or reduce net income in the years of the analysis. Such effects were not considered in the table.
Chart 1 – Return composition2
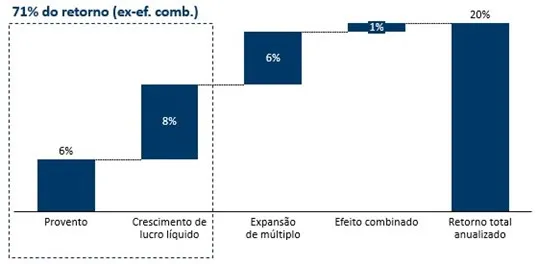
Source: Economática, Capital IQ, Arctic Analysis
If we now look at the returns since 2018, the results have a different dynamic:
Table 2 – Highest annual returns on the Brazilian stock market since 20183
| Enterprise | Annualized return | Revenue | Net profit expansion | Multiple expansion | Efeito combinado |
|---|---|---|---|---|---|
| 1 Petro Rio | 167% | 0% | 48% | 81% | 39% |
| 2 Banco Inter | 162% | 1% | (62%) | 591% | (368%) |
| 3 Banco Pan | 153% | 2% | 57% | 58% | 36% |
| 4 Inepar | 111% | 0% | 3% | 105% | 3% |
| 5 Romi | 110% | 15% | 40% | 31% | 24% |
| 6 WEG | 101% | 1% | 29% | 54% | 17% |
| 7 Magazine Luiza | 96% | 0% | (25%) | 161% | (40%) |
| 8 Eneva | 94% | 0% | (11%) | 119% | (13%) |
| 9 CSN | 89% | 3% | (13%) | 110% | (11%) |
| 10 JHSF | 81% | 4% | 61% | 9% | 8% |
| 11 TOTVS | 79% | 1% | 95% | (9%) | (8%) |
| 12 Sinqia | 78% | 0% | (28%) | 147% | (41%) |
| 13 EMAE | 74% | 7% | 5% | 56% | 7% |
| 14 Comgás | 73% | 14% | (7%) | 64% | 3% |
| 15 Kepler Weber | 70% | 1% | 164% | (37%) | (59%) |
Source: Economática, Capital IQ, Arctic Analysis
Composition of returns of a theoretical portfolio composed of the 15 assets in table 1 above, considering equal weights for each asset.
For the analysis, companies that had negative net profit in 2018 or 2020 LTM were excluded, since it is not possible to measure the components of the TSR of these. Furthermore, a liquidity filter of >R$25,000/day was applied throughout all years of the analysis. The analysis covers the period from December 28, 2018, to February 26, 2021; therefore, companies that IPOed after this period are not included in the analysis. Some of the companies presented may have suffered non-recurring impacts that inflate or reduce net income in the years of the analysis. Such effects were not considered in the table.
Companies with the highest returns in recent years had the P/E multiple expansion component as the factor that contributed most to their annualized returns—with some interesting cases, such as Banco Inter, where net income contracted, but the multiple expansion effect contributed to a return of 591% per year! Chart 2 below illustrates the relevance of the multiple expansion effect on these companies' returns.
Chart 2 – Return composition4
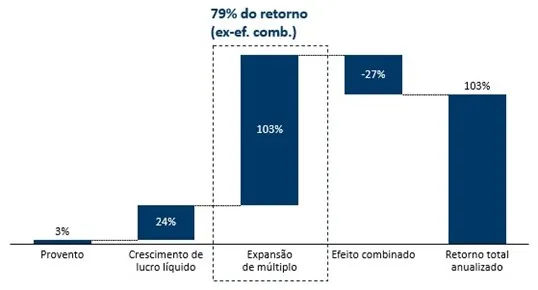
Source: Economática, Capital IQ, Arctic Analysis
It's important to emphasize that the effect of multiple expansion doesn't necessarily indicate that the company has become expensive. Other reasons may explain the expansion of this factor: (i) there is an expectation of profit growth or (ii) the company was cheap and underwent a price adjustment.
Although 2020 was not a “typical” year due to the pandemic, the results obtained are similar to those mentioned by major investors in other periods in history:
“[…] in the short run, the market is like a voting machine – tallying up which firms are popular and unpopular. But in the long run, the market is like a weighing machine–assessing the substance of a company” – Ben Graham
The above quote from Benjamin Graham, considered the father of value investing and mentor to Warren Buffett, explains this concept. In the short term, stock market fluctuations can be caused by psychological and emotional factors, leading "Mr. Market" to price stocks too high or too low; while in the long term, a company's fundamentals eventually prevail, reflecting on its share price.
The return composition of a theoretical portfolio composed of the 15 assets in Table 2 above, considering equal weights for each asset. It is worth noting that in the analysis, the combined effect is negative, despite the growth in net income and the expansion in the multiple, because there is a strong presence of extreme results, distorting the consolidated view of the portfolio. Even so, it is possible to observe the relevance of the expansion in the multiple as the main contributor to the total return.
Besides him, John Maynard Keynes in his work “The General Theory of Employment, Interest and Money” compared the speculative activity of short-term investors to a beauty contest, where the important thing is not to judge who is the most beautiful, but rather to judge by imagining who others will vote for:
“[…] professionals trade stock, not based on their own long-term forecast of companies’ assets but on the anticipation of market valuation after a few months a company.” – John Maynard Keynes
Keynes, disregarding the merits of the monetary policies he preached, was an above-average manager, having delivered 16% per year of performance between 1922 and 1946 – not a bad result considering that it was a very turbulent period for the stock market, with the 1929 crisis and World War II between 1939 and 1945.