
Long-Term Stock Investing (Part 2)
Dear investors,
Given the turbulent environment we live in, we have dedicated the last few letters to providing a historical perspective on stock investments.
We have already written two letters on this topic. The first addressed the topic of investing in times of crisis, and the second compared the historical returns of stocks vs. fixed income in various countries.
In this letter, we delve deeper into the topic and provide an analysis focused on the Brazilian market.
It's common to hear news reports and analysts criticizing investments in Brazil. The problems cited are well-known: political instability, fiscal deficits, historically high inflation (although it has been controlled in recent years), decades of low economic growth, among others.
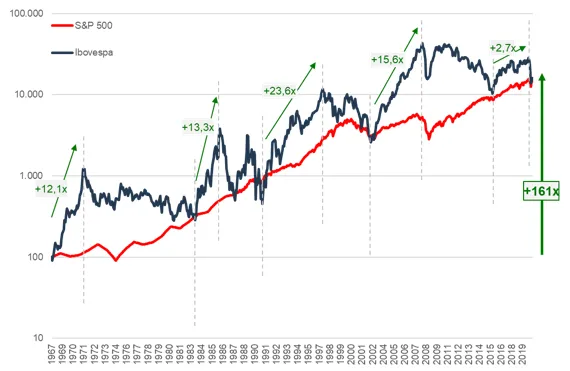
Despite all these problems, the Brazilian stock market has a strong return track record. From the Ibovespa's inception in January 1968 until May 2020 (in the midst of the Covid-19 crisis), the Ibovespa returned 161 times in dollar terms (equivalent to an annual rate of 10.21 T3T per year), compared to 148 times for the S&P 500 (10.01 T3T per year) over the same period. The Brazilian index's return is superior to the US index's even when we include 2020, which has been a dismal year for the Ibovespa (a return of -431 T3T vs. -51 T3T for the S&P 500, both in dollar terms).
These results appear in chart 1 below, which shows a history of the Ibovespa marked by downward cycles accompanied by periods of extraordinary appreciation.
Chart 1 – Historical return of Ibovespa vs. S&P 500 in Dollars1
This result seems counterintuitive, particularly when we consider our turbulent political and economic history. Since the index's creation in 1968, Brazil has experienced a military dictatorship, two impeachments, experimented with seven different currencies, and endured numerous economic crises. During this period, the country certainly experienced economic growth below its potential, so how can this result be justified?
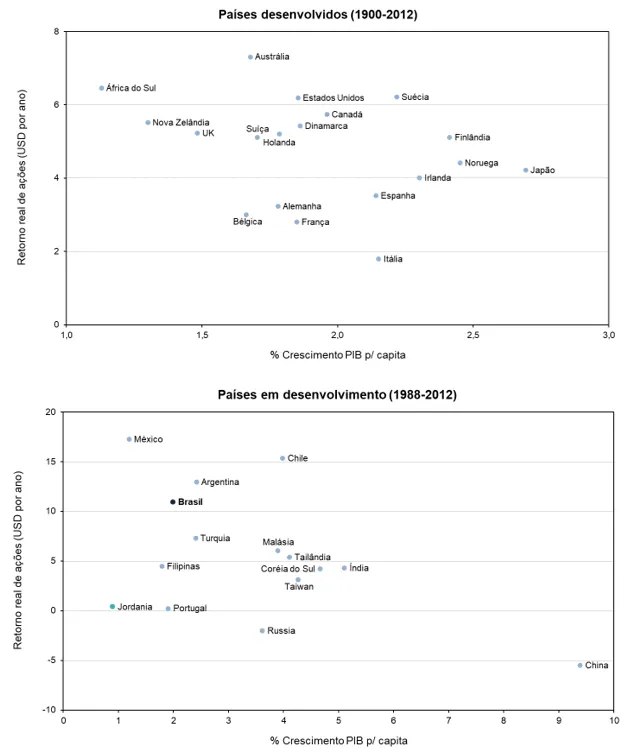
Contrary to popular belief, a country's economic growth has little correlation with its stock market performance, especially considering that we live in a globalized economy where global economic growth is paramount. Data from 34 countries collected over a period of 112 years (1900–2012) for developed countries and 24 years (1988–2012) for developing countries show a surprising result: a low correlation between economic growth and stock market valuation.
Brazil, for example, is one of the countries that presented the best returns during this period despite weak economic growth.
Chart 2 – Stock Returns vs. Economic Growth2
Why does this happen?
There are three hypotheses to justify this trend:
- In our globalized world, many countries' stock indexes feature significant multinationals or exporting companies whose results are more closely tied to the performance of the global economy than their local ones. In Brazil, 37% of the Ibovespa index is comprised of companies linked to commodities (Petrobras, Vale, Suzano, Klabin), industrial exporters (Embraer, Weg), or with significant international subsidiaries (Ambev, JBS, Natura, Gerdau).
- In many countries, capital markets are underdeveloped, and there are a limited number of publicly traded companies. These companies do not necessarily reflect the overall performance of the economy. Furthermore, due to their size, these companies often have significant competitive advantages over their smaller competitors and are able to achieve higher-than-average returns on invested capital, which contributes to higher stock market returns.
- As with individual stocks, higher growth is not necessarily linked to higher returns because expectations are often already built into stock prices through higher multiples.
It's worth reflecting on the importance of long-term stock investing. Despite its excellent historical performance, the Ibovespa index has a history of high volatility, with years of sharp declines followed by years of exceptional gains. This result can be seen in chart 1 and is also illustrated by the following chart:
Chart 3 – Annual and cumulative return of the Ibovespa, in reais (1995-2020)3
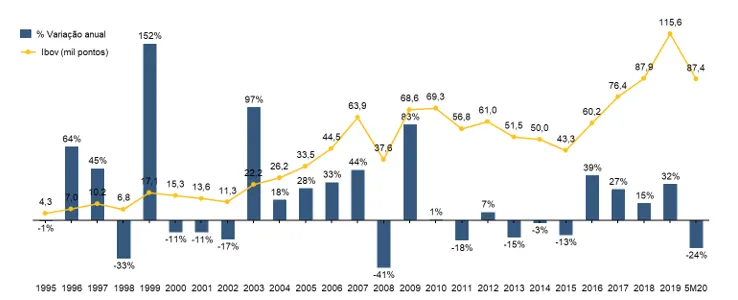
An investor who had sold their shares in 2002, disappointed with the market's performance, would have missed a great opportunity for profits that presented itself between 2003 and 2007. The same thing happened in 2008, 2015 – who knows, maybe it will be the case in 2020?
Knowing the volatility of the Ibovespa, investors might wonder if a "time the market" investment strategy wouldn't make sense—investing in stocks when the market is down and selling when it's up. While this makes theoretical sense, the problem with this strategy is that no one knows which direction the market will go, whether it will rise or fall, and waiting for the ideal moment to enter can generate a huge opportunity cost.
Research conducted in the United States comparing market analysts' estimates of the S&P 500's appreciation with actual results reveals significant distortions in almost every year. Some examples: in 2008, the estimate was a 16% appreciation; what actually happened was a 37% decline. In 2013, the estimate was a meager 3% appreciation; the result: a 32% appreciation.
The point here isn't to criticize the analysts' work, but rather to show that, in the short term, the stock market is unpredictable. Therefore, we believe the best strategy is to always be invested and, thus, enjoy the long-term benefits that stocks provide.
1Source: Análise Ártica; Data presented for the period between Jan/68 (beginning of Ibovespa) and May/20; S&P considering dividend reinvestment (SP500TR), whose data are presented annually between 1968-88, and monthly from 1988 onwards
2Source: Stocks for the Long Run, Jeremy J. Siegel (2014)
3Source: Arctic Analysis