
Where does the exchange rate go?
Dear investors,
Since the beginning of the Covid-19 crisis in 2020, the dollar exchange rate has fluctuated between R$ 5.00 and R$ 6.00, close to the historical peak value recorded on May 14, 2020, when the dollar exchange rate reached R$ 5.93, the highest nominal value since the inception of the real in 1994.
Although we are already getting used to the dollar at this level, it is worth remembering that, in the 5 years prior to the crisis, the American currency fluctuated between R$ 3.00 and R$ 4.00 and, at the beginning of the last decade, the dollar was quoted close to R$ 2.00.
Given these vastly different values, the question arises: what is the fair value of the dollar? And where is it headed?
In this letter, trying to help answer these questions, we update a study we first conducted in 2013, which collects data from over 50 years and estimates what the equilibrium value for the exchange rate would be.
Although there are a number of theories that attempt to explain the "equilibrium" exchange rate, it is impossible to predict it accurately. Every day, this rate is determined by the laws of supply and demand in conversion operations between different currencies. For example, if there is a large influx of foreign investors interested in investing in Brazil, they need to convert their dollars into reais. This increases demand for reais, and our currency appreciates, as happened in 2010-2011.
In the Central Bank's most recent Focus bulletin, market analysts expect that we will end the year with the dollar at around R$ 5.40 – at the beginning of the year, these same analysts predicted the dollar at R$ 5.00 at the end of 2021.
As Edmar Bacha, one of the creators of the Real Plan, rightly put it, “the exchange rate was created by God to humiliate economists.”
However, in the long term, studies indicate that maintaining purchasing power parity between currencies determines the exchange rate. Using the Big Mac Index, created by The Economist magazine, as an example, we can illustrate its logic. In 1994, a Big Mac cost R$1.42 in Brazil. In 2021, the same sandwich costs R$1.40, a 9.0-fold price increase over the same period. What's the reason for this increase? It stems primarily from inflation in raw materials and labor costs in the country. The minimum wage rose from R$1.40 in July 1994 to R$1.045 today (an increase of over 16 times), and the price of a pound of beef has increased 14-fold in the last 27 years.
In the United States, a Big Mac cost US$1.04T in 1994. American inflation during this period was more contained than ours, and today a Big Mac sells for US$1.04T. The implicit exchange rate in the price of a Big Mac in both countries was 1.04 in 1994 (R$1.04T 2.42 / US$1.04T 2.32), and is 3.9 today (R$1.04T 21.90 / US$1.04T 5.66). Its evolution during this period reflects the uneven price variation in the two countries. It is no coincidence that in 1994 the exchange rate was such that one dollar was worth one real, and before the crisis caused by Covid-19, the exchange rate was fluctuating around R$1.00. In fact, studies have shown that the Bic Mac Index is surprisingly accurate in tracking exchange rate trends between countries over the long term¹.
We analyzed the relationship between exchange rates and inflation for a series of currencies from different countries, covering a period of over 50 years, and in all cases, the purchasing power parity relationship proved to be quite solid. Brazil's case is the most emblematic because, since 1960, we have had eight different currency denominations (cruzeiro, cruzado, cruzeiro novo, etc.), periods of hyperinflation, and nine zeros removed from the currency. The nominal exchange rate varied significantly: one dollar bought 12,985 cruzeiros in February 1986, and only 0.84 reais in October 1995.
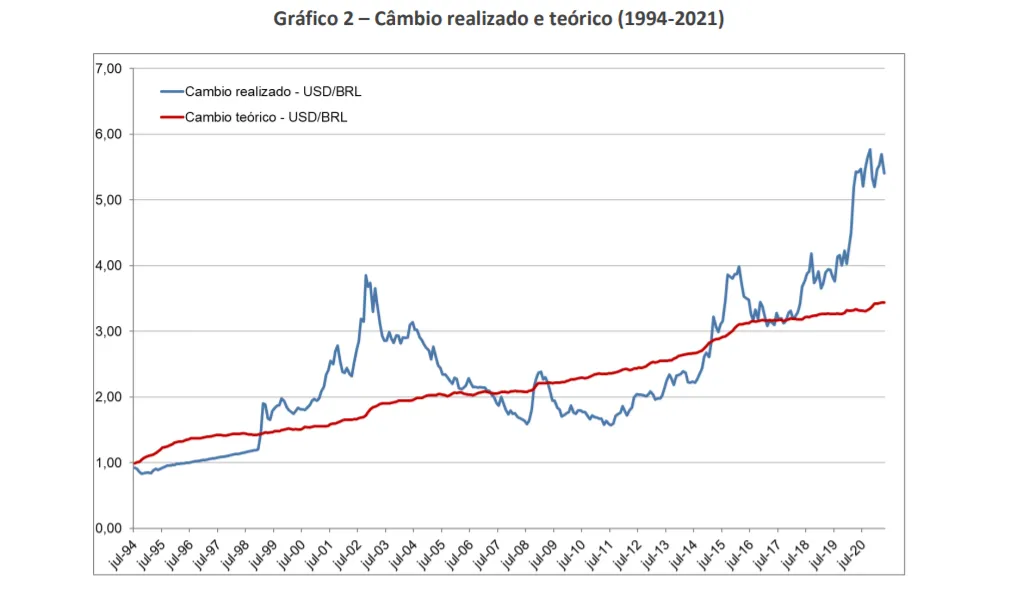
When we analyze the historical exchange rate of the Brazilian currency against the dollar, removing the effect of inflation in both countries, we see that the exchange rate variation is much smaller, and that it fluctuates around an equilibrium point.
Chart 1 below, which covers the period since the early 1970s, shows how periods of appreciated and depreciated currency have alternated over time.
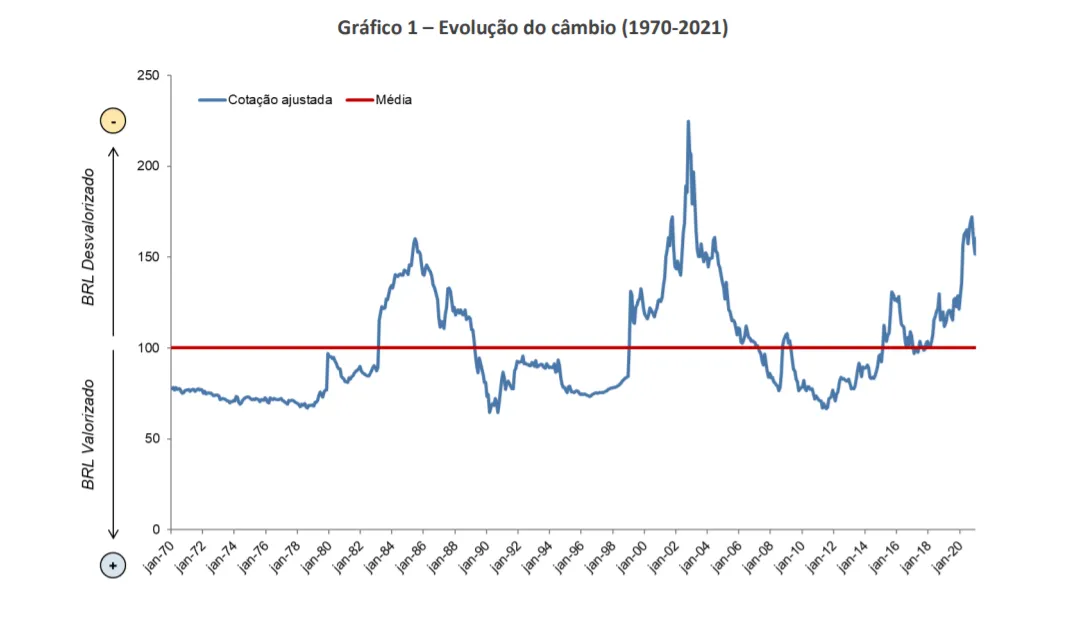
While this methodology doesn't allow us to make short-term predictions, we can make some directional inferences that can be useful in long-term investment decisions.
The first is that, despite having experienced several crises and moments of euphoria throughout our recent history, the exchange rate always returns to its equilibrium level. Currently, this level would be between R$ 3.30 and R$ 3.70 – surprising considering current levels.
We've only had one other period, 2002, in which the exchange rate fell even more in relative terms than it has now. In other words, the value the dollar reached in May, despite a nominal record, is still not a record devaluation in real terms of our currency against the dollar, which occurred on October 22, 2002. On that day, the dollar closed at R$ 3.95, which, in today's values, would be equivalent to R$ 7.922. The graph shows how, in some moments of financial stress, the exchange rate deviated more sharply from its "fair" value.
Another important point is that periods of currency overvaluation or devaluation can be long. For example, for eight years, between 1999 and 2006, our currency was significantly devalued, and, conversely, for the next eight years, between 2007 and 2014, we experienced a period in which the real remained strong against the dollar. Finally, it's important to note that the equilibrium exchange rate increases over time (red line in the graph above). This is due to the fact that Brazil has historically had much higher inflation than the US. Therefore, even if the nominal exchange rate remains stuck at its current level between R$ 5.00 and R$ 6.00, the inflation differential between countries may be able to return the exchange rate to an equilibrium level.
In the current climate, where inflation is once again a concern for investors, this is certainly a scenario that deserves attention. Our last letter (from April 2021) addresses the topic of inflation in more detail and presents our perspective on why we believe stocks work as a hedge against inflation.
¹ Burgernomics: the economics of the Big Mac standard, Journal of International Money and Finance
² Calculated considering the accumulated inflation in Brazil in the period (193%) and discounting the accumulated inflation in the United States (46%) Volume 16, Issue 6, December 1997, Pages 865-878